Web Statistics January 2013

Wednesday, 30 January 2013

Our Wild Prediction - Our Wild Prediction came true

Our WILD 1500 Prediction came true. WOW!

Back on the 13/12/2012 - Last year 2012   IN THIS POST HERE  we gave our wild prediction and said that the market was looking strong and also told our VIP members we were looking for 1500 to come on the S&P 500. 

At the time the S&P was sitting at about the 1410 level. 

Well some sniggered, some laughed, and some were ready to call the crazy farm and wanted to tell of our little tale. :-)

But again, here we are!

And here is the chart after todays close.... We actually closed above 1500.

1500 reached
1500 reached on S&P 500


We actually went up and touched 1503 on the S&P 500. 

The VIP members on our blog did very well, and again I want to thank our members for taking time out of their day to read our blog. 

I do not want to take the credit, I give all the credit to market analysis and technical analysis. When you do these things properly and know how to listen to the charts you can put things in your favour. And that can pay off very handsomely. 

Trade what you see, not what you think may happen. 

Chalk up another one! Drinks are on me! :-)

WHAT IF YOU KNEW WHICH WAY THE MARKET WAS ABOUT TO MOVE BEFORE IT HAPPENED?  CLICK HERE To Join Our VIP ELITE GROUP  -- FREE 10 Day Trial Offer Today! 

Tuesday, 29 January 2013

Dow Jones Transports Chart - Strong Dow Jones Transports Chart

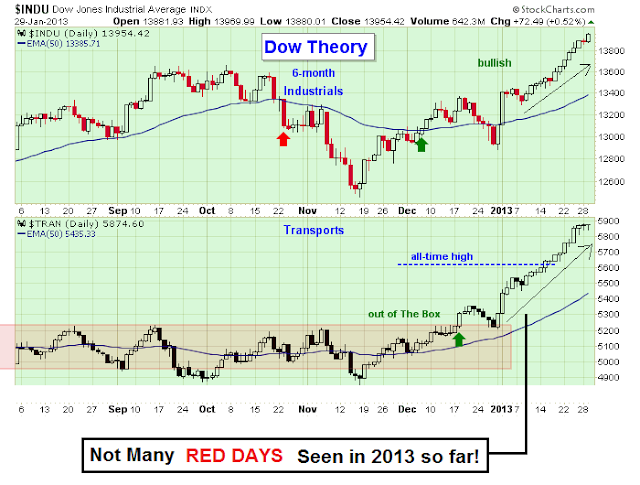
Have a look at the dow jones transports chart below.

What we have noticed is that our breadth indicator charts have been spot on, as on the chart below, the dow jones trasports chart is showing us that we have hardly even seen one red day on the market this year. WOW!

Over $44 billion dollars has been put into work on the market since the 1st of January, and as  you can see they want to put this money to work, or make it work for them (as they say)

We said at the start of the year, DO NOT FALL IN LOVE WITH THE DOWNSIDE, and now you can see why!.

The DOW JONES TRANSPORTS CHART does look strong, and yes, a top will come soon, however we just look and read charts first, and the dow jones transports chart below is still looking very bullish.

dow jones transports chart


The vix chart below is showing us that it has been very suppressed lately and has struggled to find a bid. As you know the VIX is the inverse trade to the S&P and stock market, it has given the bulls just what they need to keep the market bullish and to keep that $44 billion dollars (we mentioned above) hard at work!!!!!!

Over the last few weeks, the VIX has tested the 14 level, and failed to get above, which has been helping the bulls. 


vix daily chart
vix daily chart


WHAT IF YOU KNEW WHICH WAY THE MARKET WAS ABOUT TO MOVE BEFORE IT HAPPENED?  CLICK HERE To Join Our VIP ELITE GROUP  -- FREE 10 Day Trial Offer Today! 

bullish flag - bullish flag on EURO

bullish flag on EURO

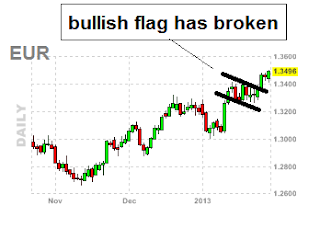
As you can see below we have a bullish flag on the EURO chart. Sentiment trader spoted the bullish flag on the EURO a few days ago, and alerted our VIP MEMBERS HERE at about the 1.34 level.

These bullish flag Patterns have been working really well lately, and now EURO is trading up at about the 1.35 level!

bullish flag pattern
bullish flag pattern EURO
WHAT IF YOU KNEW WHICH WAY THE MARKET WAS ABOUT TO MOVE BEFORE IT HAPPENED?  CLICK HERE To Join Our VIP ELITE GROUP  -- FREE 10 Day Trial Offer Today! 
Monday, 28 January 2013

JOIN OUR VIP GROUP TODAY

As you can see our FREE blog houses all our ideas, charts, technical analysis. We are top of our game and accurate, as you can see, but just wait till you see what is in our VIP section here.

JOIN OUR HIGHLY ELITE TRADERS AND ANALYSTS AND LEARN THE BEST KEPT SECRETS IN MAKING MONEY ON THE GLOBAL AND US STOCK MARKETS!

DON'T GAMBLE WITH YOUR HARD EARNED MONEY! LEARN EVERYTHING YOU HAVE ALWAYS WANTED TO KNOW ABOUT MAKING CONSISTENT MONEY ON THE MARKET QUICKLY! LET THE GURUS HOLD YOUR HAND AND SHOW YOU WHAT THEY ARE DOING EXACTLY AT THE PRECISE MOMENT. 

SCREW WHAT WE THINK!.... LISTEN TO WHAT OUR CURRENT CLIENTS ARE SAYING ABOUT OUR VIP SERVICES!   CLICK HERE TO READ CURRENT VIP TESTIMONIALS!

IF YOU ARE SERIOUSLY INTERESTED IN TRADING LIKE THE PROFESSIONALS DO AND ANALYZING THE MARKETS PROPERLY, THEN OUR VIP GROUP IS FOR YOU! APPLY NOW AS THIS OFFER IS LIMITED AND WE CAN CLOSE IT AT ANY TIME!

PLEASE NOTE : THIS IS AN EXCLUSIVE OFFER! THERE ARE LIMITED MEMBERSHIPS AVAILABLE SO  DON'T DELAY! ACT NOW! HIT THE APPLY BELOW IT ONLY TAKES 2 MINUTES! 

 Our  VIP section here.    is now open, and we would like to invite you to join our services so you can benefit from all our analysis.

WHAT IF YOU KNEW WHICH WAY THE MARKET WAS ABOUT TO MOVE BEFORE IT HAPPENED?  CLICK HERE To Join Our VIP ELITE GROUP  -- FREE 10 Day Trial Offer Today! 

Bonds Chart - Bonds Chart

Bonds Chart

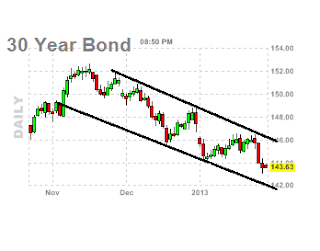
If we have a look at the daily bonds chart below you can see that we are in a downwards channel. This is what is giving equities and the indicies lots of life and vitality at the moment as money is coming out of bonds and into stocks and equities at the moment. 

daily bonds chart
daily bonds chart


WHAT IF YOU KNEW WHICH WAY THE MARKET WAS ABOUT TO MOVE BEFORE IT HAPPENED?  CLICK HERE To Join Our VIP ELITE GROUP  -- FREE 10 Day Trial Offer Today! 
Saturday, 26 January 2013

spx weekly chart - spx weekly chart update

spx weekly chart update

Many weeks ago, we did predict the market to go up higher. (est 1500 spx)

For proof.... ==> VIEW THIS POST HERE

We were saying 1500 was coming, and believe it or not, on Friday, we got within 2 pts of that happening. LOL.


You can see below on the AI sentiment that the S&P which is obviously EXTREMELY overbought, is still on the bullish side, or has room to move higher if it wants to!


ai sentiment
ai sentiment


Taking a look at the S&P 500 daily chart, we have a 'double confirmation' the bulls are still in charge. 

1) We have an inverted head and shoulders pattern that has formed back in OCT 2012 and we broke out of this early 2013. 

2) We have broken the neckline of the inverted head and shoulders and since early JANUARY 2013 we have been travelling in a nice upwards channel, that has not yet been broken to the downside. 


spx daily chart
spx daily chart


Even in December we said not to fall in love with the downside, and that was corrrect. There were many traders caught short in early 2013. 


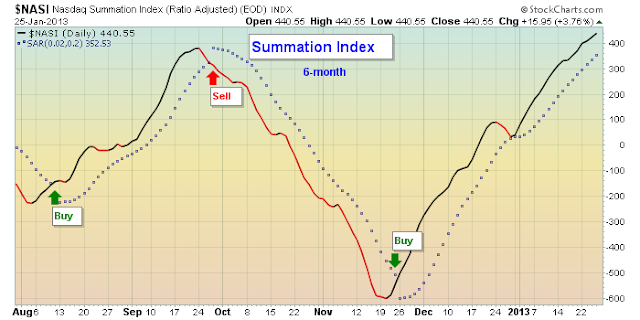
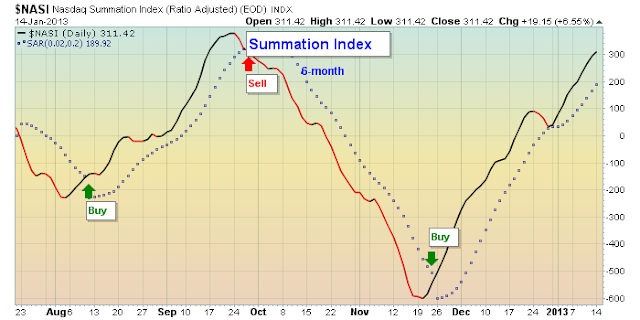
The summation chart is also another good market breadth indicator that gives us a good analogy on the overall sentiment of the stockmarket and indicies. Even though there are many bears who have been calling a top the last few months, the summation goes against all of these pundits, and has been clearly saying we are still in a BUY THE DIP kind of market. 


summation chart
summation chart


Yes, I understand that right now, things are overbought, and I do agree with that whole heatedly. Yes eventually the market will top out, However it is important to be patient and trade what we see, and not what we think may happen. We read charts first and trade off of them and leave emotions in the background.


WHAT IF YOU KNEW WHICH WAY THE MARKET WAS ABOUT TO MOVE BEFORE IT HAPPENED?  CLICK HERE To Join Our VIP ELITE GROUP  -- FREE 10 Day Trial Offer Today! 
us bonds daily chart - us bonds daily chart look horrible

us bonds daily chart look horrible

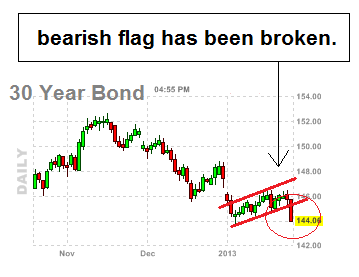
If we take a look at the us bonds daily chart it looks horrible at the moment.

Right now it looks to me that this chart has a bearish flag that has now been broken, which as  you know the us bonds daily chart is the inverse to the S&P 500 so that means this is bearish for bonds, and bullish for stocks and equities at the moment.


WHAT IF YOU KNEW WHICH WAY THE MARKET WAS ABOUT TO MOVE BEFORE IT HAPPENED?  CLICK HERE To Join Our VIP ELITE GROUP  -- FREE 10 Day Trial Offer Today! 

Friday, 25 January 2013

Dow Jones Transports - Dow Jones Transports steaming ahead

The market at the moment is steamrolling ahead. Amazingly we are only now just a 2 or 3 points away from our 1500 target! WOW! You have to love charts, and also technical analysis, I do not claim to be a guru or a psychic, but I do know how to read charts properly and forget the news. That is how we are so accurate with our calls.

Right now the tick data is yet again at oversold levels, and we shall see a rally in globex or open hours I think.

tick data
tick data


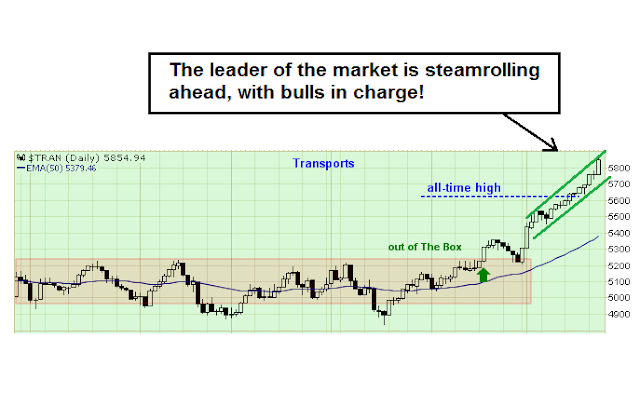
Dow Jones Transports chart. 

Take a look at the Dow Jones Transports chart and have a look at the very nice upwards channel we are in. This is proof that the bulls are still alive and well. As we have been saying for months, we are still in buy the dip mentality, which has not only been correct, but a smart thing to do since the start of 2013.

Looking at the Dow Jones Transports chart we seem to think higher prices are coming.
dow jones transports chart


WHAT IF YOU KNEW WHICH WAY THE MARKET WAS ABOUT TO MOVE BEFORE IT HAPPENED?  CLICK HERE To Join Our VIP ELITE GROUP  -- FREE 10 Day Trial Offer Today! 

Thursday, 24 January 2013

1493 came

well 1493 came on the market we are still going up closer to our 1500 target! WOW only a few points away. Can it do it? 

We seem to be in upwards channel which has not broken yet.


WHAT IF YOU KNEW WHICH WAY THE MARKET WAS ABOUT TO MOVE BEFORE IT HAPPENED?  CLICK HERE To Join Our VIP ELITE GROUP  -- FREE 10 Day Trial Offer Today! 
Tuesday, 22 January 2013

Wild Prediction - Our Wild Prediction Coming True

Back on the 13th Of December 2012 right at this blog I made a very WILD prediction.

I said that the S&P would be going to 1500. SEE PROOF & POST HERE

I posted this when the S&P was at about the 1410 level. 

At the time, I was laughed at, and people sniggered, when I told some of my trading buddies, even they were starting to think I was crazy, and needed to take some medication. LOL.

But here we are today. Just a few weeks later, and we are nearly at my WILD PREDICTIONS target. WOW! You gotta love technical Analysis.

Right now we are at 1490 and only 10 points away from our wild prediction of 1500. WOW!


WHAT IF YOU KNEW WHICH WAY THE MARKET WAS ABOUT TO MOVE BEFORE IT HAPPENED?  CLICK HERE To Join Our VIP ELITE GROUP  -- FREE 10 Day Trial Offer Today! 
Nasdaq chart - Nasdaq chart is telling

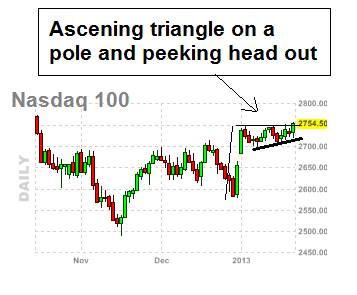
We can see that the Nasdaq or the leader of the market has been holding well. Right now on the daily chart you can clearly see we have an ADSCENDING TRIANGLE on a POLE and we have just broken out of the resistance and we are peeking our head just a little above that resistance line. Interesting!

In our view this is BULLISH looking chart and can preceed higher prices. Time will tell.

Happy trading.


Ascending Triangle
Ascending Triangle on a pole


WHAT IF YOU KNEW WHICH WAY THE MARKET WAS ABOUT TO MOVE BEFORE IT HAPPENED?  CLICK HERE To Join Our VIP ELITE GROUP  -- FREE 10 Day Trial Offer Today! 

the vix

As you can see the vix is still surpressed, and that is going to give bulls a bit of energy they need.

It seemed that as soon as people stopped talking about 1500, now is probably the time it will come.


WHAT IF YOU KNEW WHICH WAY THE MARKET WAS ABOUT TO MOVE BEFORE IT HAPPENED?  CLICK HERE To Join Our VIP ELITE GROUP  -- FREE 10 Day Trial Offer Today! 
Saturday, 19 January 2013

RSI Average - RSI average and what it is telling us

Below is a chart of the 14 Day RSI indicators following Stocks which belong to the S&P 500.

As you can see the blue arrow is suggesting, that things are very overbought at the moment.

It doesnt mean we are going to crash, it just means that things are very overextended right now.

60 - 65 are extreme levels, and we up at a sell zone area. Right now we are at the 60 mark.


WHAT IF YOU KNEW WHICH WAY THE MARKET WAS ABOUT TO MOVE BEFORE IT HAPPENED?  CLICK HERE To Join Our VIP ELITE GROUP  -- FREE 10 Day Trial Offer Today! 

Friday, 18 January 2013

baltic dry index chart

baltic dry index chart

Check out the baltic dry index chart below, we can see on the weekly we have a NICE buy signal and it is likely we see higher pricing in the coming weeks.  :-)

We should see 1000 come and possibly higher. :-)


baltic dry index chart


WHAT IF YOU KNEW WHICH WAY THE MARKET WAS ABOUT TO MOVE BEFORE IT HAPPENED?  CLICK HERE To Join Our VIP ELITE GROUP  -- FREE 10 Day Trial Offer Today! 

Thursday, 17 January 2013

soybeans oil


Check out soybeans oil on the daily chart, it looks to be in an ascending triangle. These are bullish formations and we should soon see a breakout to the upside. Once through markets noise at about the $52 it could lead to higher prices. The Target is in the mid 50's


WHAT IF YOU KNEW WHICH WAY THE MARKET WAS ABOUT TO MOVE BEFORE IT HAPPENED?  CLICK HERE To Join Our VIP ELITE GROUP  -- FREE 10 Day Trial Offer Today! 
One More Day In Opex

Well we got our rally, and it was a NICE ONE!

So much so, that the hourly chart is now overdone to the upside (overbought) and we would not be surprised to see some sort of a retracement in the next day or so.  

Remember we are in OPEX (options expiry) this week, and with one more day, statistically the friday of January OPEX's tend more to be a RED day. 

That also goes along with the hourly charts also. We shall see.


hourly chart
hourly chart


WHAT IF YOU KNEW WHICH WAY THE MARKET WAS ABOUT TO MOVE BEFORE IT HAPPENED?  CLICK HERE To Join Our VIP ELITE GROUP  -- FREE 10 Day Trial Offer Today! 

Bonds Trouble

Looks like there is trouble coming for bonds. See how we went up to the falling resistance line on the downwards channel, and now bonds is experiencing more downwards pressure.

Could mean the indicies are going to rally for a few days, just as planned! :-)


WHAT IF YOU KNEW WHICH WAY THE MARKET WAS ABOUT TO MOVE BEFORE IT HAPPENED?  CLICK HERE To Join Our VIP ELITE GROUP  -- FREE 10 Day Trial Offer Today! 

Wednesday, 16 January 2013

ascending triangle pattern

ascending triangle pattern

There is nothing much to report here in OPEX, as all seems to be quiet going into the end of the week.

Tomorrow we have the JOBLESS CLAIMS, the philly fed, and a few earnings report to kick off the day.

It seems right now, every time the S&P comes off 5-7 points we rally higher into the end of the day.

What I thought was worth mentioning is the NASDAQ chart which seems to be bumping and grinding a little higher. But on the daily chart below, we seemed to have formed an ASCENDING TRIANGLE on a pole.

normally these sorts of patterns precede higher prices, especially with the indices.


ascending triangle pattern


WHAT IF YOU KNEW WHICH WAY THE MARKET WAS ABOUT TO MOVE BEFORE IT HAPPENED?  CLICK HERE To Join Our VIP ELITE GROUP  -- FREE 10 Day Trial Offer Today! 

Tuesday, 15 January 2013

Market Update - Latest market update

Well yesterday we warned a FALLING BULLISH WEDGE had formed. It seemed we were spot on => SEE LINK HERE!

It seemed that played out perfectly. :-)

First have a look at the leader of the market, the Dow Jones transports. It is in a very nice uptrend and holding very well. 

This has been a freight train, We have only had a few red days since the 5200 level. 

dow jones transportation
dow jones transportation 


The Summation or market breadth has clearly been signaling to NOT FALL IN LOVE WITH THE DOWNSIDE, and that has been correct. We are still on a BUY DIPS stance and nothing has changed for now. We need to continue to monitor this chart in the coming weeks, but for now as said, we are still in a buy the dips position on the market. 

summation chart
summation chart


The nasdaq has been going sideways the last few days, but the hourly chart below is signaling we are oversold again, and some sort of bounce is coming. 

nasdaq hourly chart
nasdaq hourly chart


WHAT IF YOU KNEW WHICH WAY THE MARKET WAS ABOUT TO MOVE BEFORE IT HAPPENED?  CLICK HERE To Join Our VIP ELITE GROUP  -- FREE 10 Day Trial Offer Today! 

Bull market or bear market - are we in a bear market

Bull market or bear market - are we in a bear market?

I see alot of analysts saying we are in the start of a bear market, or the market is looking bearish here. 

Forget the noise, it is best to follow the charts. And here is a good one as you will see below.

This is the bull / bear market indicator, and you can see just how good it has been for the last 10 or so years.

There is no guessing with this chart, you can clearly see we are currently in a bull market at the moment. See how the red and blue lines are moving up in tandem. That is a clear case that we are still in a bull market. 

bull market
bull market


WHAT IF YOU KNEW WHICH WAY THE MARKET WAS ABOUT TO MOVE BEFORE IT HAPPENED?  CLICK HERE To Join Our VIP ELITE GROUP  -- FREE 10 Day Trial Offer Today! 

Monday, 14 January 2013

Bullish falling wedge - bullish falling wedge forming

bullish falling wedge

When we have a look at the S&P intraday, I think since the 11th of January we have a bullish falling wedge on our hands, so we are looking for a break to the upside maybe. These can take a few days to form so we will know more very soon.

As you can see on the chart both the buyers and sellers are slowly getting squeezed here, and we will soon know. :-)

bullish falling wedge

WHAT IF YOU KNEW WHICH WAY THE MARKET WAS ABOUT TO MOVE BEFORE IT HAPPENED?  CLICK HERE To Join Our VIP ELITE GROUP  -- FREE 10 Day Trial Offer Today! 

Sunday, 13 January 2013

Significant week - Significant week for market.


This will be a significant week for the market, as OPEX is apon us. 

The S&P  broke out of the bull flag and looks like it wants to work its way higher. 

I will say this, $22.8 billion dollars poured into stock funds last week alone, yes, you did read that right I said $22.8 billion dollars. WOW!, that is the beginning of a trend you will see continuing because the fed has stepped up and said QE purchasing may stop this year. I do not know if that is the case, or they are just playing games, however, many people with 401k's and mutual funds have been forced to look at investing in the stockmarket. That is what you saw happen last week.

So this week will be very significant. 


WHAT IF YOU KNEW WHICH WAY THE MARKET WAS ABOUT TO MOVE BEFORE IT HAPPENED?  CLICK HERE To Join Our VIP ELITE GROUP  -- FREE 10 Day Trial Offer Today! 

Market Update Jan

The S&P finally broke its bullish flag, and technically ever if we see some profit taking, there could be higher prices coming on the S&P.

This week is OPEX week, so things could get a bit erratic, which is normal.

Here are some stats,


1/14: OE Monday, Dow up 15 of 20
1/18: OE day, Dow down 10 of 14
Jan OE week, Dow down 9 of 14


So could be a bit of a topsy turvy week.

bullish flag
bullish flag?


Interesting enough, the summation on the weekly chart is suggesting higher prices are coming on the market. We are at 735, however there is room to move to the 990's so breadth remains positive.

summation index
summation index


WHAT IF YOU KNEW WHICH WAY THE MARKET WAS ABOUT TO MOVE BEFORE IT HAPPENED?  CLICK HERE To Join Our VIP ELITE GROUP  -- FREE 10 Day Trial Offer Today! 
Thursday, 10 January 2013

put call ratio

Total imbalance in the put / Call data is telling us this rally we saw today is not short winded, and there might be a green day on the cards tomorrow FRIDAY 11th January 2013. 

The technicals and the patterns seen is giving us a double confirmation here. So we shall see what happens. :-)


WHAT IF YOU KNEW WHICH WAY THE MARKET WAS ABOUT TO MOVE BEFORE IT HAPPENED?  CLICK HERE To Join Our VIP ELITE GROUP  -- FREE 10 Day Trial Offer Today! 

The bullish flag worked

It seems we were SPOT ON with our previous post today. Patience paid off.

The market had thrown a bullish flag pattern, which is obviously bullish, and the S&P finally did break out of this flag and took off to the upside.

You have to take your hat off to technical analysis and this was almost text book. 3-4 day bullish flags work the best with the indicies, and we would not be surprised to see the market go a higher obviously.

The tick reading below is at +175 and still has some room on the upside too.


WHAT IF YOU KNEW WHICH WAY THE MARKET WAS ABOUT TO MOVE BEFORE IT HAPPENED?  CLICK HERE To Join Our VIP ELITE GROUP  -- FREE 10 Day Trial Offer Today! 

Wednesday, 9 January 2013

bullish flag - bullish flag on dow jones

bullish flag - bullish flag on dow jones

If I was a gambling man, I would say we are about to see a pop higher on the DOW JONES. The coiling we have been seeing the last few days could have turned into a bullish flag.

That means we could be expecting a breakout of the flag pattern seen below and higher prices are coming in the next day or so, at least.

It seems the BULLS have certainly not lost hope yet.


bullish flag
bullish flag on dow jones chart


WHAT IF YOU KNEW WHICH WAY THE MARKET WAS ABOUT TO MOVE BEFORE IT HAPPENED?  CLICK HERE To Join Our VIP ELITE GROUP  -- FREE 10 Day Trial Offer Today! 

indicies holding


Looking at the S&P 500 it seems that the indicies are still holding well. They are still coiling and we will need to break the 1460 level to regain some strength. There is a possibility we might see some rallying into the end of week. There are no guarantees, but that would give the bulls a bit more encouragement, and our targets up higher would then not be that far off.


The Russell has already coiled and the bulls came back strong by the close today, so it may be a tell tail sign that the S&P is about to do the same. The russell even though not a leader of the markets, can preceed the S&P so the next few days will be interesting.


WHAT IF YOU KNEW WHICH WAY THE MARKET WAS ABOUT TO MOVE BEFORE IT HAPPENED?  CLICK HERE To Join Our VIP ELITE GROUP  -- FREE 10 Day Trial Offer Today! 

Tuesday, 8 January 2013

fiscal cliff deal - frog in boiling water

fiscal cliff deal - frog in boiling water

fiscal cliff dealfrog in boiling water


Weeks after the fiscal cliff deal, I want to share something with you that will shock you right to the core of your being.

You will need to brace yourself, because what I am about to tell you is going to be hard to swallow  but its something you need to know because soon, it will effect everyone.

Many of you have asked me about fiscal cliff deal ? I tend to think the deal turned most the of people in the US into a frog in boiling water. Most people just do not get it.

In the next 2 or so years, the US dollar is going to lose much of its purchasing power.

The elitists of the world are creating this mess, and it is coming down the track. But to help this move along at the right speed, they are using what I term "Forced DEBT CREATION" with the recent fiscal cliff deal.

If you remember back a few weeks ago, everything on the news, the papers, the internet and everywhere you heard about the fiscal cliff deal right?

Well I was laughing my ass off the whole time. Why? Because I knew it had no meaning whatsoever!

This was merely all a smoke screen. I was telling my friends they would probably come through at the last minute with a fiscal cliff deal, and they did. I even posted about that here at the blog, as that is what the charts were saying :-)

But what I did not want to admit is the recent fiscal cliff deal was nothing more than forced debt creation, and adding to the already tumultuous amount of debt that surrounds the US at the moment.  They are doing this, so that every country in the world and every state, city and county in the US in such massive debt. Debt so bad they will not be able to recover. That will make the collapse of the US almost inevitable.

So what we are talking about here is FEAR and DEBT, and both are a means of control.

With the fiscal cliff panic, they used the term cliff, which would be a quick clean violent drop. What I am talking about here is a slow and steady debt freak show, and slow implosion of the US and world wide economies.

They are doing this, because they do not want the average person to wake up to what is going on. To get that momentary snap - the light bulb above the brain saying "Oh my god, I cannot believe what is actually going on" They do not want people to wake up to the TRUTH!

Those creating this mess, want the average person asleep and not able to understand what is going on beneath the surface.

Let us use the frog in boiling water principle. You put that frog in cold water and slowly turn up the heat the frog will boil to death without jumping out. But if you put the frog straight into hot water he will quickly jump out instantly.

frog in boiling water


Now do we want to be a bunch of boiling frogs?

No.

All this is part of a bigger plan, to steal from the poor and to feed that money to the rich. So you need to know the serious debt problems in the US will implode soon, and the low income and middle classes will be taxed to oblivion. So get ready and prepare as best you can.


WHAT IF YOU KNEW WHICH WAY THE MARKET WAS ABOUT TO MOVE BEFORE IT HAPPENED?  CLICK HERE To Join Our VIP ELITE GROUP  -- FREE 10 Day Trial Offer Today! 

Nasdaq Hourly Chart

Nasdaq Hourly Chart

Today we posted an update HERE on the nasdaq chart. We made some notes on how the nasdaq the last few days, has been doing nothing more than just coiling or in a low range tight price pattern and working out where it wants to go next.

If we have a look at the HOURLY Nasdaq chart, we can see that the very quick upwards rally has left a gap on the chart. This is highly unusual and we must warn you that these gaps do eventually close, sooner or later.

For now, however, since the 3rd of January we have topped and just going sideways, however on the nasdaq chart   the nasdaq seems to have found a bit of support, and we are oversold on the hourly, which means that in the next few days it is probable we will see some sort of bounce, and even a break out to the upside, depending on how strong the bulls feel.


Nasdaq Hourly Chart
Nasdaq Hourly Chart


WHAT IF YOU KNEW WHICH WAY THE MARKET WAS ABOUT TO MOVE BEFORE IT HAPPENED?  CLICK HERE To Join Our VIP ELITE GROUP  -- FREE 10 Day Trial Offer Today! 

Monday, 7 January 2013

Nasdaq Update - A quick nasdaq update

Nasdaq Update

Right now traders are just holding their breadths to see what happens.

If you have a look at the nasdaq, (or the leader of the market) we seem to be what I term coiling where the market spends a few days of doing hardly anything, after a big movement.

Do not worry this is normal, after such an extreme move, and the smart money taking their position.

The nasdaq has still not hit its upper targets, and the market is holding fairly well. So right now the best thing do to is to be patient.

GOOD THINGS COME TO THOSE WHO WAIT? well, that could be the case here. However we may have to wait till later in the week to get a better read of things.

The bulls still have the upper hand here, otherwise we would be down much more significantly.


Nasdaq Update
Nasdaq Update 


WHAT IF YOU KNEW WHICH WAY THE MARKET WAS ABOUT TO MOVE BEFORE IT HAPPENED?  CLICK HERE To Join Our VIP ELITE GROUP  -- FREE 10 Day Trial Offer Today! 

The vix a tell tail sign


The VIX went down to the 14 mark in the last few days. I have not seen a drop that quickly on VIX in a long time. From 23 down to under 14 in just a few days.

This can be a warning sign, and needs to be monitored in the coming days.

vix chart
vix chart


WHAT IF YOU KNEW WHICH WAY THE MARKET WAS ABOUT TO MOVE BEFORE IT HAPPENED?  CLICK HERE To Join Our VIP ELITE GROUP  -- FREE 10 Day Trial Offer Today! 

Saturday, 5 January 2013

CRUDE UPDATE

CRUDE UPDATE

On boxing day (26th of December 2012) we warned to watch crude. SEE THE POST HERE

At the time, crude was trading at $90

Fast forward a week later and crude is now up at $93  :-)

Here is the chart below. $93 has arrived, but looking at the chart below its likely that we will see higher prices in the coming weeks. It is trading within a very nice skinny upwards channel.


WHAT IF YOU KNEW WHICH WAY THE MARKET WAS ABOUT TO MOVE BEFORE IT HAPPENED?  CLICK HERE To Join Our VIP ELITE GROUP  -- FREE 10 Day Trial Offer Today! 

Natural gas prices - says pull my finger

natural gas prices

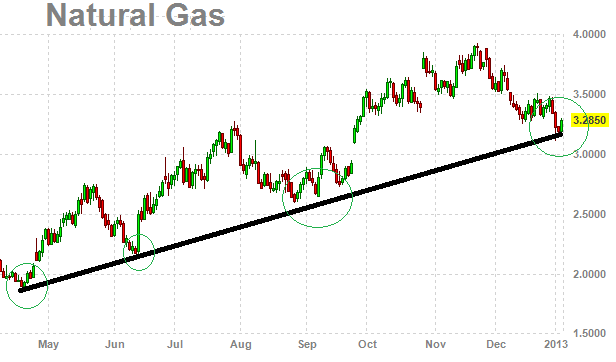
Have a look at the natural gas prices chart. Ever since may 2012 we have been in a very nice uptrend.

You can see this on the chart below. Every time we hit the black rising support line it bounced and produced nice updraft rally. :-)

As of Friday at the close we have again hit this nice rising support line and it could be time for another updraft rally to at least the $4.00 level.

Keep an eye on this one.


natural gas prices
natural gas prices


WHAT IF YOU KNEW WHICH WAY THE MARKET WAS ABOUT TO MOVE BEFORE IT HAPPENED?  CLICK HERE To Join Our VIP ELITE GROUP  -- FREE 10 Day Trial Offer Today! 

Inverted head and shoulders - a inverted head and shoulders

Inverted head and shoulders ?

Today lets do some pure Technical analysis and measurements on the S&P 500 chart.

The holiday reversals at the end of December we skidded down but I will still class this at the bottom of the right shoulder of the inverted head and shoulders.

So we have the bottom of the head and shoulders at about the 1340 level. If take the measured move from the bottom of the head to the neckline, and double that over, we are up around the 1495 - 1500 level. Possibly higher.

We have already broken the neckline, and broken it very convincingly! So it will be interesting what happens in the next week or so.

The weekly chart on the daily if you zoom back is also asking for the 1490 - 1500 level. So that is giving us a double confirmation we might see these levels.

The smart money is now back in the market, and they were not short. The novice retails traders who traded through xmas were short, and it was the wrong move to make.

As you can see on the chart below, what a difference 2 or 3 days make on the market.

Inverted head and shoulder patterns do not always work out, but when they do, its a real sight to see. So now we have a double confirmation we will wait and see what happens. :-)


inverted head and shoulders
WHAT IF YOU KNEW WHICH WAY THE MARKET WAS ABOUT TO MOVE BEFORE IT HAPPENED?  CLICK HERE To Join Our VIP ELITE GROUP  -- FREE 10 Day Trial Offer Today! 

Friday, 4 January 2013

risk on risk off - is it risk on or risk off


weeeeeeee! Up We Gooooooo!!!! LOL :P


The S&P is up over 70 points in 3 days. WOW! IT has been a complete BEAR SMOKING to the upside here.

We warned our readers to not fall in love with the downside, when we were in low volume holiday trading and now you can see why :-)

Today was a good day in the market. MOC we had almost 7 billion volume to buy. Even though the markets are overextended, they can remain that way for a while. Bears have really been creamed in the last few days, and probably lost all hope. LOL :->

What is happening right now, is that we get all these little FALSE sell offs, and that has been tricking the bears. They have been trying to test the market on the sell side, they put in their buys stops, we rally up higher, then their stops go off like a rocket and that gives us more of a boost higher!

When you have NATURAL CASH buying or buyers in the market, like we do have right now they send us up higher and keep us triggering the buy programs and or buy stops up overhead. That's what I saw many weeks ago, and warned our readers and that is why we keep ripping to the upside.

Over the last 4 days, smart money has put $5.5 billion dollars to work in the broader markets. In laymen's terms this means in the short term, the markets are most likely to go HIGHER. YES!

I guess we can say that there is a little bit of risk here also at the moment. The higher the market goes up without any serious pullbacks, at some point we will get that pull back and it will probably be a good sized one.

Now we are above our important levels of 1440 and 1450, it means that we are possibly making our way to the 1485 - 1490 now, so prepare yourself. :-)

Already our members are off to a flying start for 2013, and we are only a few days in. :-)

Happy trading :-)


WHAT IF YOU KNEW WHICH WAY THE MARKET WAS ABOUT TO MOVE BEFORE IT HAPPENED?  CLICK HERE To Join Our VIP ELITE GROUP  -- FREE 10 Day Trial Offer Today! 

Spx Weekly Update

The market just closed today and as you can see, even though there are people whining and bears screaming the market is going to crash, we remain vigilant and just watch the charts.

It paid off hansomely for us in 2012 and will do so again in 2013.

Right now the summation chart is telling us to be cautious, but to still buy the dips.

Eventually we will have a sell signal soon, but do not worry, we will get plenty of warning.

This is one of the best market signals, and we do not trade on opinion. We use charts and indicators to and listen to them, and act accordingly. Right now the summation is saying the bulls are winning.

summation chart
summation chart


When we have a look at the weekly chart of the S&P, we are now getting close to our first target discussed 1470. We are not there yet, however we are only about 4 points away. :-) *winks*

The weekly chart is very bullish and we are up near the highs seen back in SEPT - OCT 2012.

We closed near the highs of this week, our thoughts are next week we could see some nice positive action and also higher prices are likely.

Looking at the chart below, we can see on the weekly chart the stochastics still has more room to move on the upside, so we would not be surprised to see more upside action next week. 1480 seems to be the next target for the bulls.


spx weekly chart
spx weekly chart


WHAT IF YOU KNEW WHICH WAY THE MARKET WAS ABOUT TO MOVE BEFORE IT HAPPENED?  CLICK HERE To Join Our VIP ELITE GROUP  -- FREE 10 Day Trial Offer Today!