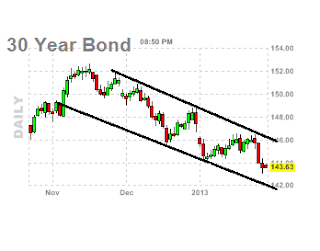
If we have a look at the daily bonds chart below you can see that we are in a downwards channel. This is what is giving equities and the indicies lots of life and vitality at the moment as money is coming out of bonds and into stocks and equities at the moment.
 |
| daily bonds chart |
WHAT IF YOU KNEW WHICH WAY THE MARKET WAS ABOUT TO MOVE BEFORE IT HAPPENED? CLICK HERE To Join Our VIP ELITE GROUP -- FREE 10 Day Trial Offer Today!

No comments:
Post a Comment