Web Statistics November 2012

Thursday 29 November 2012

vix chart

vix chart below on the weekly chart is suggesting a very nice descending triangle pattern.

if we break the 11 or 12 region on this vix chart we could be off to the races on the SPX and stockmarket. We are not there yet, but we are getting close. The buyers are slowly getting weeded out by the sellers as you can see, and this is BULLISH for the market in the coming weeks.

vix chart
vix chart


The vix chart is the inverse to the indicies such as the nasdaq chart (below) which shows the bulls are grinning and winning at the moment. Since the middle of November we have only had one red day! WOW!


nasdaq chart
nasdaq chart


Yes we are due for some sort of pullback, but while others out there are getting very bearish or calling for a market crash, the overall sentiment is not suggesting a bearish tone for the market at all right now!.


WHAT IF YOU KNEW WHICH WAY THE MARKET WAS ABOUT TO MOVE BEFORE IT HAPPENED?  CLICK HERE To Join Our VIP ELITE GROUP  -- 10 Day Trial Offer Today! 

Wednesday 28 November 2012

The Roar Of The Bulls.

As stated, the hourly chart said a dip was coming, and that dip occurred HARD AND FAST and the bulls came right back!


The VIP MEMBERS HERE and also THIS POST IN THE FREE SECTION..... we warned that the santa clause rally might have started. 

Even though we are still seeing fiscal cliff problems it seems we were 100% accurate and we are still sticking to that [analogy] as we watch the market do its thing. The prudent thing to do right now is NOT FALL IN LOVE WITH THE DOWNSIDE....u will see why in a few months I am sure. 


Again as several members have asked,  Below I will post the one of the best market sentiment charts the SUMMATION INDEX chart below! As you can see, we have just seen a FRESH buy signal occur ONLY DAYS AGO!!! and I do not mess with this leading indicator, it is revealing that alot of the smart money is slowly buying up this market and a bigger more extensive rally is coming later on leading into 2013 (just as we have been hinting) .


WHAT IF YOU KNEW WHICH WAY THE MARKET WAS ABOUT TO MOVE BEFORE IT HAPPENED?  CLICK HERE To Join Our VIP ELITE GROUP  -- 10 Day Trial Offer Today! 

Tuesday 27 November 2012

Turnaround Tuesday

As we wrote a few days ago => THIS POST HERE  the market was in holiday reversal mode and the BUS WAS GETTING FULL on the long side.

Some selling was expected and that is EXACTLY what we got today! This is called a TURNAROUND TUESDAY and we are witnessing the smart money slowly coming back into the market just as we expected to sell positions.


On the nasdaq hourly chart below you can see now how things were very overbought (from last weeks holiday reversal) and due to some of the selling action today, we have a clear sell signal. So sentiment trader would not be surprised to see some more selling at least in the very short term. 


What we are witnessing is very normal after a major holiday. The smart money is not 100% back at their desks trading, but rest assured will be back by the end of the week.


WHAT IF YOU KNEW WHICH WAY THE MARKET WAS ABOUT TO MOVE BEFORE IT HAPPENED?  CLICK HERE To Join Our VIP ELITE GROUP  -- 10 Day Trial Offer Today! 

Monday 26 November 2012

Stalling At Resistance

Today we only had a 5 handle range. Nothing to sneeze at. 

The ES rally from 11/16 extended into Friday as expected – the turn window on 11/26-11/27 could reverse us down sharply if the Fiscal Cliff talk sounds less jolly.

Mondays lately have been very very slow, and today was the same. 

I do not know what they are doing with all this fiscal cliff stuff but with only a few weeks left
on the trading calendar, they better sort out something soon, until then we watch the charts.

If you have a look at the dow jones daily chart we seem to be stalling at previous resistance. 


dow jones chart
dow jones chart


My thoughts are that we have had a big rally (over the last week), and knowing that we are going into the end of the year I doubt we will just SKYROCKET from here. 

So again I am talking about a bit of a pullback that could be starting  here and is overdue, and then soon after a rally or what I call a santa clause rally that is already sticking its head out. 

happy trading :-)


WHAT IF YOU KNEW WHICH WAY THE MARKET WAS ABOUT TO MOVE BEFORE IT HAPPENED?  CLICK HERE To Join Our VIP ELITE GROUP  -- 10 Day Trial Offer Today! 

how to survive economic collapse

how to survive economic collapse coming ? Well the video below is a great resource and will teach you how 10 different ways. 


Below - 8 min video teaches how to survive economic collapse coming!


WHAT IF YOU KNEW WHICH WAY THE MARKET WAS ABOUT TO MOVE BEFORE IT HAPPENED?  CLICK HERE To Join Our VIP ELITE GROUP  -- 10 Day Trial Offer Today! 

Sunday 25 November 2012

full moon bus club


full moon bus club

If we were on a bus right now with the market, I can hear someone screaming at the back!!  "The BUS IS GETTING FULL....THE BUS IS GETTING FULL!!! Ahhhhh!"

LOL! ha ha. :-P

As you can see the market over the last week (The holiday reversal we talked about) we had nothing but UP, UP, UP and I did not see any of the smart money involved. So that is a warning the BUS IS ACTUALLY GETTING VERY FULL, and in the very short term this market may need to take a break.

full moon bus club
full moon bus club


Below the nasdaq hourly chart is extremely overbought, and its pointing to some down at least in the short term.

full moon bus club
full moon bus club


We have to remember the smart money will be returning this week. And normally that can mean a reversal of the holiday reversals, and with the hourly charts the way they are, I would be expecting the market to have a bit of a break from the relentless upwards and we see some kind of downwards momentum AT LEAST FOR THE FIRST PART OF THE TRADING WEEK!.

Happy trading! :-)

WHAT IF YOU KNEW WHICH WAY THE MARKET WAS ABOUT TO MOVE BEFORE IT HAPPENED?  CLICK HERE To Join Our VIP ELITE GROUP  -- 10 Day Trial Offer Today! 

bullish stock market - bull vs bear market

bullish stock market ?  bull vs bear market ?

So with so many analysts out there screaming we are in a bearish stock market and a bullish stock market which one is it?

Do not listen to the news, the government or the gurus out there, most of them are "PAID" to lie.

To work out wheather we are in a bullish stock market and to see the real truth we do not have to go any further than the charts. They never lie!!! Always remember that.

The best chart to look at right now is the bull vs bear market indicator

bullish stock market

As you can see the chart above is telling us that a bull market (or bullish stock market) began at the start of this year 2012 back in January. Now with 5 weeks left in the 2012 calendar trading year, nothing has changed, and we are still in what I would be calling a bullish stock market.

Now this does not mean we will just skyrocket up for the next 10 years, but you can see how well this bull vs bear market indicator has performed over the last 10 or so years.

There is no sign of the bullish stock market action ending just yet. For that to happen we will need to see a nice cross downwards of the blue and red lines.

WHAT IF YOU KNEW WHICH WAY THE MARKET WAS ABOUT TO MOVE BEFORE IT HAPPENED?  CLICK HERE To Join Our VIP ELITE GROUP  -- 10 Day Trial Offer Today! 

Friday 23 November 2012

santa claus rally - Is he really here

we have been talking about a santa claus rally and it seems we have the beginning signs of that.

What we must remember here is that this week we have to almost toss out the window, as the smart money is gone from the market, and as I warned we had the market reversal that was actually expected, and happen almost 100% of the time leading into major holidays.

The "smart money" does come back next week.

To the charts, and we can see on the hourly how we have had nothing but straight up on the market. The hourly chart is at EXTREME overbought conditions and it is likely the market needs to cool off some time next week. It is wayyy overdue.

We have been overbought now for a few days, and normally when this occurs its almost guarenteed we see some sort of sell off occur and will not be too far away.


santa claus rally
santa claus rally 


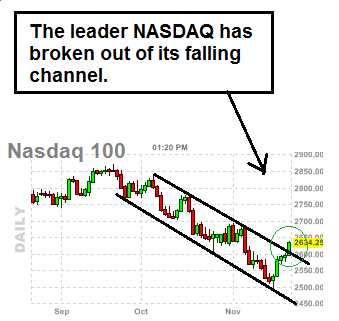
Taking a look at the Nasdaq daily chart we can see the very nice downwards channel that started in OCT 2012 has now been breached and signalling higher prices are coming, but first we probably need to see the market cool off after such a massive run this week. Infact a bit of selling next week even if it is heavy would actually be good thing for the bulls. 

santa claus rally
santa claus rally 

As you can see when the smart money is out the market, we can see many violent moves in either direction. This holiday reversal was a good one, and more volume and smart money will slowly drift back into the market in by the end of next week.

Have a good weekend. Happy trading :-)

WHAT IF YOU KNEW WHICH WAY THE MARKET WAS ABOUT TO MOVE BEFORE IT HAPPENED?  CLICK HERE To Join Our VIP ELITE GROUP  -- 10 Day Trial Offer Today! 

Wednesday 21 November 2012

santa claus rally - are we seeing the start of a santa claus rally

santa claus rally ? Really? When I got up this morning and took a look at some charts the first thought that went through my noggin' upstairs is that there could be a santa claus rally starting.

Have a look at the S&P weekly chart below and decide for yourself if we are about to experience a santa clause rally. As you can see every time we have hit the major support line on the weekly charts we have bounced quite healthily. Will this happen again? well...... I go more into detail in THE VIP SECTION HERE however, time will tell!.


santa claus rally

santa claus rally
santa claus rally


santa claus rally


I will let you be the judge of a santa clause rally or not, but be careful I see alot of analysts saying the market is about to crash, but as you can see there is not reason to FALL IN LOVE WITH THE DOWNSIDE right here and now.

I will be out of town for the next few days, and will not be able to post an update. Happy trading! :-)


WHAT IF YOU KNEW WHICH WAY THE MARKET WAS ABOUT TO MOVE BEFORE IT HAPPENED?  CLICK HERE To Join Our VIP ELITE GROUP  -- 10 Day Trial Offer Today! 

Thanksgiving trading

For the thanksgiving trading holidays are here again as We are now close to the American holiday known as "Thanksgiving". This is a time on the market where "major holidays"  in the U.S. are celebrated and bigger institutional traders expect to witness the "Holiday Market Reversal" and is exactly what we have seen.

Look at the nasdaq below. Only green so far this week, after a sea of red that last few weeks.


 If you have been monitoring the markets so far this week Holiday Reversals have materialized in many markets across almost all asset classes. Just a heads up to watch for this, leading into the all major holidays throughout the year!

WHAT IF YOU KNEW WHICH WAY THE MARKET WAS ABOUT TO MOVE BEFORE IT HAPPENED?  CLICK HERE To Join Our VIP ELITE GROUP  -- 10 Day Trial Offer Today! 
Tuesday 20 November 2012

nasdaq analysis - nasdaq analysis says overbought

nasdaq analysis for today we are taking a look at the hourly chart!

There are 3 very important things we must mention with the nasdaq analysis below.

1) Holiday reversals this week have creating lower than average volume buying. 

2) There is a gap that has not been filled yet in the 2860 - 80 area. 

2) Stochcastics on the hourly chart are suggesting we are VERY overdone or quite overbought in the short term and this might create some pressure on stocks and indices in the next few days.


nasdaq analysis
nasdaq analysis


nasdaq analysis is hinting that the last several weeks we have not seen 4 days in a row of buying, and this might attract some sellers or profit takers in the short term.


WHAT IF YOU KNEW WHICH WAY THE MARKET WAS ABOUT TO MOVE BEFORE IT HAPPENED?  CLICK HERE To Join Our VIP ELITE GROUP  -- 30 Day Trial Offer Today! 

Monday 19 November 2012

holiday reversals.

The market bounced up nicely today. Which was due if you have a look back at the charts studied.


Our only concern is that this could be a market reversal, gearing up for the Thanksgiving holiday. As there is thiner volume than normal and its quite common to get market reverals leading up to major holidays. 

WHAT IF YOU KNEW WHICH WAY THE MARKET WAS ABOUT TO MOVE BEFORE IT HAPPENED?  CLICK HERE To Join Our VIP ELITE GROUP  -- 30 Day Trial Offer Today! 

Friday 16 November 2012

Dow Jones Transports Charts

We got down to the JUNE lows today, and they were not taken out. Infact, we bounced nicely there, and  These levels were very significant, and if we can stay above the 86 level that would more likely create more buying opportunities in the coming weeks.


Probably some nice opportunites out there going into December. Next week we have Thanks giving holiday coming up and this is a major holiday and could create thin trading. Just a heads up.


WHAT IF YOU KNEW WHICH WAY THE MARKET WAS ABOUT TO MOVE BEFORE IT HAPPENED?  CLICK HERE To Join Our VIP ELITE GROUP  -- 30 Day Trial Offer Today! 

Thursday 15 November 2012

bearish markets starting

bearish markets are setting up and we are ready for a big crash on the market?

bearish market tones?

I hear alot of screaming analysts out there saying we are about to crash. Others swore on their mothers grave that we were about to bounce months ago. LOL OUCH!

What we are saying is go back and look at the market sentiment as always, and see what that is saying in bullish markets, and bearish markets, and you will always get the right answer!!!

BEARISH MARKETS HERE?

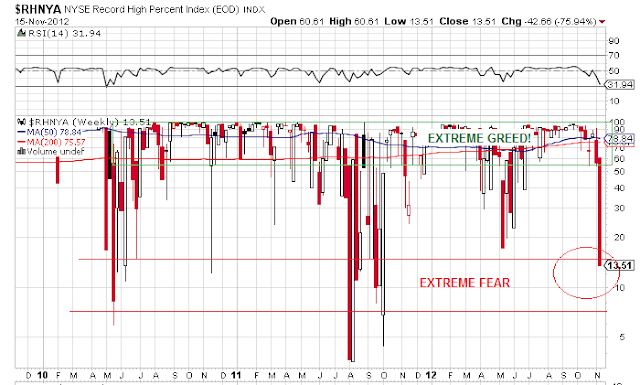
It is not rocket science. If we go and take a look at market sentiment right now mid November 2012 we can clearly see that right now the market breadth is indicating EXTREME 'PANIC' FEAR levels or FEAR amongst investors out there right now.

As you are well aware, we want to be the contrarians or oppose that view. That is what the smart money is doing at the moment. That is how they make their money time and time again. So we just follow that sentiment.


bearish markets
bearish markets


Yes ok, we could go and sell off a bit more, but the Thrust chart clearly shows we have reached quite extreme panic levels we have not see for some time, and  usually means we are getting close to seeing some sort of a MAJOR bottom.


WHAT IF YOU KNEW WHICH WAY THE MARKET WAS ABOUT TO MOVE BEFORE IT HAPPENED?  CLICK HERE To Join Our VIP ELITE GROUP  -- 30 Day Trial Offer Today! 

Market Breadth - What is market breadth saying?

The bears have done a lot of damage to the market in the last several weeks, everyone was out there screaming buy buy buy, but we warned of more downwards coming on the market. That is exactly what happened. Yesterday from opening bell there was sell stop program going off one after the other all the way to the closing bell.

Right now the Nasdaq chart (the leader) is down at its 50% retracement level from the last MAJOR UP move which started late 2011.

The nasdaq market breadth chart below, shows we are getting close to the market being in oversold / buy zone territory. It is signaling this down move is now getting long in the tooth! There is a chance we can sell off a bit lower, but it doesn't matter, the breadth is telling us that we should see the start of another rally soon.

VIP MEMBERS <== have the exact levels and targets to look for!.

WHAT IF YOU KNEW WHICH WAY THE MARKET WAS ABOUT TO MOVE BEFORE IT HAPPENED?  CLICK HERE To Join Our VIP ELITE GROUP  -- 30 Day Trial Offer Today! 

Tuesday 13 November 2012

fiscal cliff - how to trade the fiscal cliff news

fiscal cliff news is all the talk of the town, yet no matter what fiscal cliff news is coming, traders are still not looking at their charts.

The bulls were not able to print a higher high today compared to last Friday. I am kind of sounding like a broken record, lol, but until this happens the bears remain in control and caution should be exercised.

fiscal cliff
fiscal cliff news

I have been warning to watch the leader "The NASDAQ" in the next few days. I saw many other pundits get excited about a bounce in early trading, however it did not last, and traders who were long got caught yet again!

Fiscal Cliff this! LOL


Look at the nasdaq chart below. I was not surprised to see fresh lows get hit today, as I cannot see any strong buy signals at the moment, even though there were lots of traders screaming to get long. So we watch and we wait. 

fiscal cliff


There is lots of news tomorrow FOMC news minutes. Sentiment is still bearish for now. These markets do not seems like they are settled yet, and there are lots of talk about about Obama and this fiscal cliff and whether there will be some sort of decisions made, but one thing I do know is that no matter the fiscal cliff news these markets are still quite unstable. 


WHAT IF YOU KNEW WHICH WAY THE MARKET WAS ABOUT TO MOVE BEFORE IT HAPPENED?  CLICK HERE To Join Our VIP ELITE GROUP  -- 30 Day Trial Offer Today! 

Monday 12 November 2012

bear flag chart - market shows bear flag chart

bear flag chart is still playing out on the S&P and we have not seen any strong buying hands come back in so far. It seems they are trying to take out more sell stops!

The bear flag chart pattern you see below is strong indication as well as looking at weekly chart, that the bears are still in control for now.


bear flag chart
bear flag chart


One of my favorite market indicators the 'SUMMATION INDEX' is still clearly on a sell signal. 


bear flag chart
bear flag chart


We have still not hit the bear flag chart target yet, but it is early in the week and anything is possible. There is much hype and histeria with the news right now, even after obama has been re-elected, but still the charts and sentiment are giving us a much better picture of the actions to take right now. When trading we must remember one IMPORTANT thing. The charts NEVER LIE! The Governments do!


WHAT IF YOU KNEW WHICH WAY THE MARKET WAS ABOUT TO MOVE BEFORE IT HAPPENED?  CLICK HERE To Join Our VIP ELITE GROUP  -- 30 Day Trial Offer Today! 

Saturday 10 November 2012

Spx Weekly Chart - Major Update


The SPX has not been performing very well in recent weeks. This week, was also a downer!

As you can see on the charts we have been in a bearish rising wedge, and RSI and Stochastics on the weekly are saying things are getting close to a bottom, but it looks like we are not quite there just yet.

Since Obama has been back in, all the market has been doing is dropping. Maybe to teach him a lesson? It doesn't matter, the news and politics mean nothing and we will follow the charts and see how they develop in the next week.


The market breadth A50R is also saying things are getting close to being oversold, it is evident  that we are not at the exact point just yet.

SPX POS 50 DMA


Please Note: Monday is a US Holiday; Veteran's Day / Bonds are closed / Stocks are open

Have a great weekend :-)

WHAT IF YOU KNEW WHICH WAY THE MARKET WAS ABOUT TO MOVE BEFORE IT HAPPENED?  CLICK HERE To Join Our VIP ELITE GROUP  -- 30 Day Trial Offer Today! 

Thursday 8 November 2012

Nasdaq Chart

Well looks like Obama is back in there is no surprises there, many people are taking their shirts off, getting drunk and celebrating, however they are forgetting 1 simple thing. Obama has done nothing to save the day, and noone, I repeat! NO ONE is better off then they were 4 years ago.

This man has rocks in his head if he thinks he can solve the current economic crisis. Anyway, I am on a rant so lets go over and take a look at the markets today.

The nasdaq chart shows a nice downwards channel. We have been inside this for many weeks now, and we will remain inside this until we break the upper falling resistance line at about the 2700 level.

I loved how yesterday they celebrated OBAMA getting back in, and then swiftly took out all the stops and back down we went. Classic manipulation at its finest. Maybe they were sending a message to obama, I don't know but it was very choppy.

Now we get to see if this was just a one day event or we head back down. If we go under 1380 on SPX that would spell real trouble. But for now we wait and see.


nasdaq chart
Nasdaq chart


WHAT IF YOU KNEW WHICH WAY THE MARKET WAS ABOUT TO MOVE BEFORE IT HAPPENED?  CLICK HERE To Join Our VIP ELITE GROUP  -- 30 Day Trial Offer Today! 

Monday 5 November 2012

The re-election Trade


I listen to the FFT guy at http://www.forecastfortomorrow.com and he is 100% accurate with his previous US election calls. He is calling for Obama to win the re-election on TUESDAY which is only hours away.

Another 4 years of Obama coming? well, I bet you are excited! ha ha. :P

Note: Election day in the United States. Markets tend to live and die with every exit pole that gets announced in the open.  So make sure you take care!

There are also big rumors at the moment, that A Deutsche Bank bought massive S&P contracts a day or so ago. That does not normally happen for no reason! Hmmmmm Very interesting!!!


It seems the market is still up and down like a yo yo. But still finding support for now.


Its seems the hourly chart on the nasdaq is still oversold, so that could help lift the market in the next day or so, while the elections sort themselves out and we see if Obama can get back in. 


WHAT IF YOU KNEW WHICH WAY THE MARKET WAS ABOUT TO MOVE BEFORE IT HAPPENED?  CLICK HERE To Join Our VIP ELITE GROUP  -- 30 Day Trial Offer Today! 

Ping Pong Game.

The s&p got down to the lower support after a trend down day last Friday, and today we bounced and it seems to be holding. Seems to be a bit of a ping pong game the last few days, leading up to the November elections. Looks like Obama is going to get in, I think.


As you can see, the tick data after fridays downwards day was hinting that things were a bit OVERDONE and a bounce was due, and that is what we have so far. There is still some room to move on the upside in the short term!. 


There are other indicators that I share with my VIP clients that is suggesting a NICE move is coming soon. To the upside, or downside???, I will let you be the judge of that, but I like what I am seeing at the moment, and things sure are setting up nicely.


WHAT IF YOU KNEW WHICH WAY THE MARKET WAS ABOUT TO MOVE BEFORE IT HAPPENED?  CLICK HERE To Join Our VIP ELITE GROUP  -- 30 Day Trial Offer Today! 

Thursday 1 November 2012

Advance Decline indicators.

Even though the market is not out the woods just yet. Have a look at the leaders advance decline chart. As you can see we dipped down into the -200 area, an area seen as good support or a BUY ZONE AREA. And from there we have seen some buying over the last few days, as predicted.

Once we cross the Zero 0 Line, that will give a more stronger buy signal, it is close but still not there.


Even though the US is getting over the hurricane damages, and the market is back trading, It seems that in the short term we are bullish for now, with one day left this week.


WHAT IF YOU KNEW WHICH WAY THE MARKET WAS ABOUT TO MOVE BEFORE IT HAPPENED?  CLICK HERE To Join Our VIP ELITE GROUP  -- 30 Day Trial Offer Today! 

The Range Continues

The markets are finally open after Hurricane Sandy shut down the exchange for a few days. Taking a look at the charts, the range continues on S&P 500 as we come back from Hurricane Sandy. This 20 point range is holding, and the dancing around seems to be continuing so far.

I do suspect we are going to see some green today but. Maybe even nice healthy green.


The hourly chart is still suggesting a bit of upwards momentum is due, even though we have had a whole week or so of nothing.


WHAT IF YOU KNEW WHICH WAY THE MARKET WAS ABOUT TO MOVE BEFORE IT HAPPENED?  CLICK HERE To Join Our VIP ELITE GROUP  -- 30 Day Trial Offer Today!