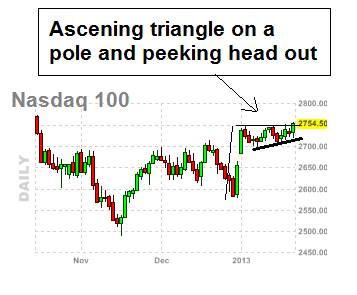
We can see that the Nasdaq or the leader of the market has been holding well. Right now on the daily chart you can clearly see we have an ADSCENDING TRIANGLE on a POLE and we have just broken out of the resistance and we are peeking our head just a little above that resistance line. Interesting!
In our view this is BULLISH looking chart and can preceed higher prices. Time will tell.
Happy trading.
 |
| Ascending Triangle on a pole |
WHAT IF YOU KNEW WHICH WAY THE MARKET WAS ABOUT TO MOVE BEFORE IT HAPPENED? CLICK HERE To Join Our VIP ELITE GROUP -- FREE 10 Day Trial Offer Today!


No comments:
Post a Comment