Many weeks ago, we did predict the market to go up higher. (est 1500 spx)
For proof.... ==> VIEW THIS POST HERE
We were saying 1500 was coming, and believe it or not, on Friday, we got within 2 pts of that happening. LOL.
You can see below on the AI sentiment that the S&P which is obviously EXTREMELY overbought, is still on the bullish side, or has room to move higher if it wants to!
 |
| ai sentiment |
Taking a look at the S&P 500 daily chart, we have a 'double confirmation' the bulls are still in charge.
1) We have an inverted head and shoulders pattern that has formed back in OCT 2012 and we broke out of this early 2013.
2) We have broken the neckline of the inverted head and shoulders and since early JANUARY 2013 we have been travelling in a nice upwards channel, that has not yet been broken to the downside.
 |
| spx daily chart |
Even in December we said not to fall in love with the downside, and that was corrrect. There were many traders caught short in early 2013.
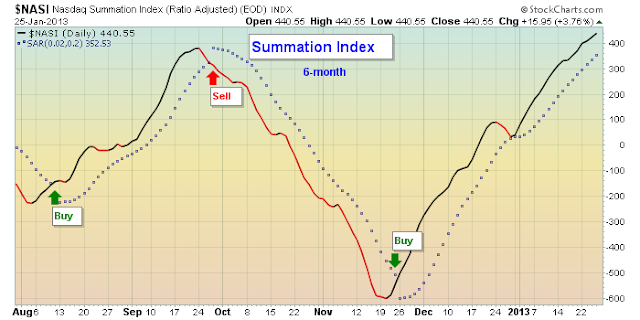
The summation chart is also another good market breadth indicator that gives us a good analogy on the overall sentiment of the stockmarket and indicies. Even though there are many bears who have been calling a top the last few months, the summation goes against all of these pundits, and has been clearly saying we are still in a BUY THE DIP kind of market.
 |
| summation chart |
Yes, I understand that right now, things are overbought, and I do agree with that whole heatedly. Yes eventually the market will top out, However it is important to be patient and trade what we see, and not what we think may happen. We read charts first and trade off of them and leave emotions in the background.
WHAT IF YOU KNEW WHICH WAY THE MARKET WAS ABOUT TO MOVE BEFORE IT HAPPENED? CLICK HERE To Join Our VIP ELITE GROUP -- FREE 10 Day Trial Offer Today!

No comments:
Post a Comment