Web Statistics The Sentiment Trader
Showing posts with label summation. Show all posts

Saturday, 26 January 2013

spx weekly chart - spx weekly chart update

spx weekly chart update

Many weeks ago, we did predict the market to go up higher. (est 1500 spx)

For proof.... ==> VIEW THIS POST HERE

We were saying 1500 was coming, and believe it or not, on Friday, we got within 2 pts of that happening. LOL.


You can see below on the AI sentiment that the S&P which is obviously EXTREMELY overbought, is still on the bullish side, or has room to move higher if it wants to!


ai sentiment
ai sentiment


Taking a look at the S&P 500 daily chart, we have a 'double confirmation' the bulls are still in charge. 

1) We have an inverted head and shoulders pattern that has formed back in OCT 2012 and we broke out of this early 2013. 

2) We have broken the neckline of the inverted head and shoulders and since early JANUARY 2013 we have been travelling in a nice upwards channel, that has not yet been broken to the downside. 


spx daily chart
spx daily chart


Even in December we said not to fall in love with the downside, and that was corrrect. There were many traders caught short in early 2013. 


The summation chart is also another good market breadth indicator that gives us a good analogy on the overall sentiment of the stockmarket and indicies. Even though there are many bears who have been calling a top the last few months, the summation goes against all of these pundits, and has been clearly saying we are still in a BUY THE DIP kind of market. 


summation chart
summation chart


Yes, I understand that right now, things are overbought, and I do agree with that whole heatedly. Yes eventually the market will top out, However it is important to be patient and trade what we see, and not what we think may happen. We read charts first and trade off of them and leave emotions in the background.


WHAT IF YOU KNEW WHICH WAY THE MARKET WAS ABOUT TO MOVE BEFORE IT HAPPENED?  CLICK HERE To Join Our VIP ELITE GROUP  -- FREE 10 Day Trial Offer Today! 

Tuesday, 15 January 2013

Market Update - Latest market update

Well yesterday we warned a FALLING BULLISH WEDGE had formed. It seemed we were spot on => SEE LINK HERE!

It seemed that played out perfectly. :-)

First have a look at the leader of the market, the Dow Jones transports. It is in a very nice uptrend and holding very well. 

This has been a freight train, We have only had a few red days since the 5200 level. 

dow jones transportation
dow jones transportation 


The Summation or market breadth has clearly been signaling to NOT FALL IN LOVE WITH THE DOWNSIDE, and that has been correct. We are still on a BUY DIPS stance and nothing has changed for now. We need to continue to monitor this chart in the coming weeks, but for now as said, we are still in a buy the dips position on the market. 

summation chart
summation chart


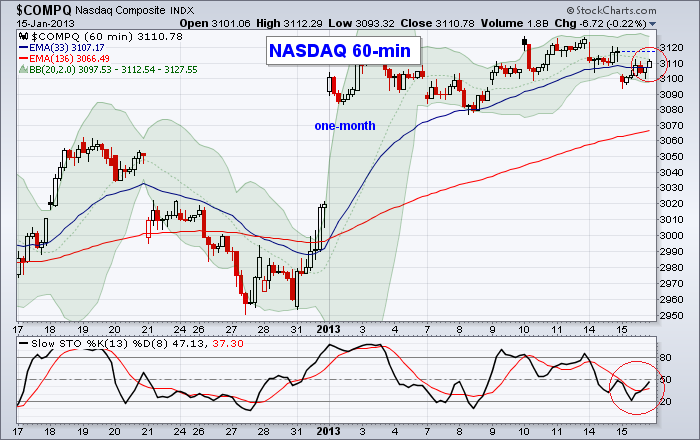
The nasdaq has been going sideways the last few days, but the hourly chart below is signaling we are oversold again, and some sort of bounce is coming. 

nasdaq hourly chart
nasdaq hourly chart


WHAT IF YOU KNEW WHICH WAY THE MARKET WAS ABOUT TO MOVE BEFORE IT HAPPENED?  CLICK HERE To Join Our VIP ELITE GROUP  -- FREE 10 Day Trial Offer Today! 

Wednesday, 2 January 2013

What the charts say

If we take a look at summation, we have not hit a sell signal in the market yet. As we have been saying, there is not reason to FALL IN LOVE WITH THE DOWNSIDE at the moment, no matter what others are saying or telling you to do.

When the charts tell you to buy dips, that is the smartest thing you should do. If you have been doing this and following your charts, you should be doing very well.  That is still what the summation is screaming at us for now. When we get to debt ceiling and fourth quarter reports, in a few weeks, that could be a different story but for now, that summation is still on a buy, and hinting to remain a bit cautious.


If you remember back a few weeks ago, we hinted that 1500 could be coming on the market. YOU CAN READ THE POST HERE . I called it a wild prediction, however with the fiscal cliff drama out of the way, it DOES NOT seem so much of a wild prediction any more.  Some readers did laugh off such claims, but see how 2 days can make a difference on the market.

Infact if we take a look at the weekly S&P chart, you can see how 1500 is not very far away at all now. The band-aid fix to the fiscal cliff did help alot and we would not be surprised to see 1500 come. I guess time will tell.


spx weekly chart
spx weekly chart


WHAT IF YOU KNEW WHICH WAY THE MARKET WAS ABOUT TO MOVE BEFORE IT HAPPENED?  CLICK HERE To Join Our VIP ELITE GROUP  -- FREE 10 Day Trial Offer Today! 

Thursday, 27 December 2012

Fiscal Cliff News and Charts


If we take a look at the the sentiment trader market breadth indicators, we can see that the news is already coming out in the charts.

While bears keep saying the market is about to crash, NO, this was just a dip on the market. Nothing more than a holiday reversal if you have been reading our updates.

We have been telling our members to NOT FALL IN LOVE WITH THE DOWNSIDE. The reason is because summation and breadth still have nice room to move on the upside. Lots of room.

Nothing has changed on summation, and it clearly is still in BUY MODE or BUY DIPS mode. That is the smartest thing to do right now. Although the summation is not as strong as it was back in NOVEMBER it still remains on a BUY stance, and we should see higher prices soon on the S&P.


summation
summation


The market breadth is now sitting on 67 and has now given us nice room to move to the upside, and we suspect the market is really ready to rally ONE LAST TIME up into early 2013 and not only surprise the bears but trick them as well. 

We will not be overbought until we reach the 85 - 90 level. So we suspect a nice rally is going to come in the next few weeks sometime and there is also a nice rally in gold and miners setting up also. 


We have been giving many warning shots that traders should still be buying dips, and not going short on the fiscal cliff news, or listening to analysts who keep saying the market is going to crash this week. We are not saying that wont happen, but the charts are telling us that is a low probability.

Right now the market breadth and leading indicators are saying the opposite and so as astute traders we must listen to the charts, and buy dips, and forget the fluff and so called analysts that do not use charts.


WHAT IF YOU KNEW WHICH WAY THE MARKET WAS ABOUT TO MOVE BEFORE IT HAPPENED?  CLICK HERE To Join Our VIP ELITE GROUP  -- FREE 10 Day Trial Offer Today!