Web Statistics The Sentiment Trader
Showing posts with label overbought. Show all posts

Tuesday, 6 June 2017

Historic Run For Tech Sector - Historic Run For Tech Sector


Historic Run For Tech Sector

"Historic Run For Tech Sector" 

in the news Historic Run For Tech Sector? What this all about..... See below. 

------------------------------

Sentiment Trader can see right now, a Historic Run For Tech Sector 


As the nasdaq pumps itself up higher and holds, what we have found interesting, we are up 23 or 27 sessions, and we can tell you that when we look back to our charts, going right back the market has never ever done that before. We are living in very interesting times. But this next chart might take your fancy!?

Look at the XLK chart or the [ technology sector ]. What a fantastic chart!!! :-0 You can clearly see how this chart has been in an uptrend for many weeks now....[see below]
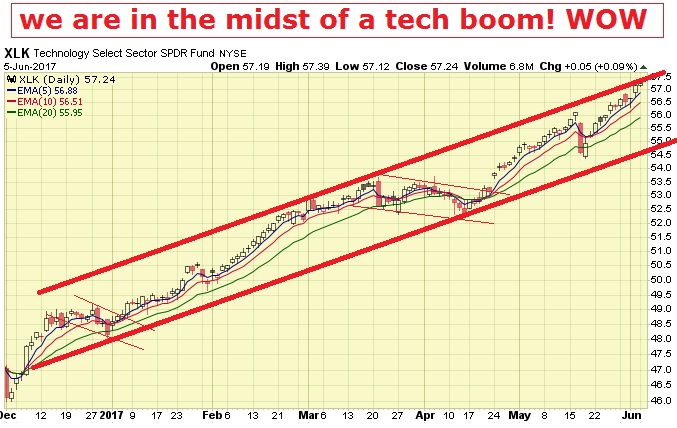
Historic Run For Tech Sector


I guess when you go and look back at history, there are 2 ways to look at this :-

1) The first you could think OH NO, this is dot com boom type stuff, sell everything, lets panic!!!!! 

Or 

2) the smart way to look at it, is MOMENTUM BEGETS MORE MOMENTUM, and its good news in the longer term we could be looking at more gains. 

So which is it? 

Well before we answer that we must admit, we have been witness to incredible momentum here. Have these bigger big cap, powerful technology companies  taken off. Yes! Of course. But its nothing like the growth and skyrocketing we saw back in 1999. What we are looking at is the facebooks, the apples, and other companies like nvidia have exploded higher, and represent 11% of the 22% gains in the nasdaq. So in other words the top 5 holdings. 

Its nothing short of incredible!!!

The question is will this continue? We think sure....at some pace, but in relative perspective you might be better looking at other pockets of the market, that are not gaining huge attention. 

Such sectors could be Utilities or finanicals, or even the transports, which have been lacking over the last several months. 

Will momentum go forward from here. Well, we would not bet against it, but as to reiterate, as a relative perspective point of view, there might be better value laying hidden in the market right now. 

A lot of this huge run in technology is based on earnings and revenue. Especially earnings growth. Earnings growth came in recently at about 12%, and that is what we can be expecting over the next 12 months. Valuations however, on a general basis are sitting at about 21 right now, which is looking a bit to expensive and overbought to us right now. But that does not mean we cannot go higher, of course. 


So all in all, we are following what the smart money is doing here. While they do not expect a 2008 type correction, they see valuations a bit [pricey] here and continue to be cautiously optimistic. 

DON'T MISS OUT ON OUR HOTTEST updates Click the link below....

Wednesday, 21 December 2016

stock market overbought - will the stock market crash soon


stock market overbought - will the stock market crash soon

"stock market overbought - will the stock market crash soon" 

in the news stock market overbought - will the stock market crash soon? What this all about..... See below. 

------------------------------

Sentiment Trader have been watching the market, and we have had a very good few months. We are now seeing the market in EXTREME overbought conditions. Lets take a quick look at our NAAD or advance decline charts. Basically as of today, you can see this market is in EXTREME or overbought tones. 

Now, don't get us wrong, we are not saying the market cannot go up into the end of year!! What we are saying is the bigger guys on wall st use these charts, and you can tell that they would not be a selling the farm to get in the market right here. That would be dangerous. 

What we care about most is chart, and this is warning us that after one of the biggest rallies on wall st, we need to realise things are OVERDONE, and the bread in the oven is over baked. If you are one of those smart investors, who BUYS LOW and SELLS HIGH, this would not be an area to start any FRESH buying!!!! Here is the chart.... . This is quite interesting for a STOCK MARKET SIGNAL with a few days until XMAS 2016. 


The Sentiment swung to the extreme optimism side. Usually, that signals a pullback.....As the holidays approach, investors expect trading volumes to drop significantly, which may lead to volatile swings within the market. "The trains to Manhattan have started to thin out as some market participants have already commenced their holiday vacation plans, so we urge caution. 

DON'T MISS OUT ON OUR HOTTEST updates Click the link below....

Monday, 4 November 2013

Market Warning Us Here

Is the market warning us here?

This is a chart I normally only share with ONLY our  VIP ELITE GROUP  -- HERE!

However I thought it was interesting that the breath of most equities belonging to the S&P 500 are telling us after such a massive run on the market, we could be about to experience a bit of profit taking or pulling back on the market.

As I have previously written on my blog, yes we are in a BULL market, but BULL MARKETS do not go up in a straight line. Some bulls have trouble with this, however it is what it is.

As you can see the A50R is up at OVERBOUGHT areas, and at 81.00 I would be thinking its an area that smart money will start to take profits, and talking to some of my colleagues we know what these guys are up to, and if we do experience a bit of a sell off in the next few weeks, it will mean our thoughts are correct.

Hope this helps.


overbought oversold


 WHAT IF YOU KNEW WHICH WAY THE MARKET WAS ABOUT TO MOVE BEFORE IT HAPPENED?  CLICK HERE To Join Our VIP ELITE GROUP  -- FREE!


Powered by 123ContactForm | Report abuse

Sunday, 28 July 2013

Dow Jones Weekly Chart

Dow Jones Weekly Chart

Top callers and those shorting this market, but be very frustrated right now. The DOW JONES WEEKLY CHART Below is show how strong and resilient this market is. You do not even have to guess when you look at the weekly chart.

The last major dip on the market seems to have just created another bullish flag we have now broken out of. I do agree this market is a little overbought, but I have been getting emails from my readers since the DOW was at 12,000 trying to convince me the market was topping out and a crash was coming. So far we have not seen that at all. It is better to let the charts do the talking for now, and right now they keep telling us a different story.

Eventually we will get to major extremes in the market, but the market can remain in extremes longer then anyone can imagine. Better to trade what you see today, not what you expect to happen tomorrow.


WHAT IF YOU KNEW WHICH WAY THE MARKET WAS ABOUT TO MOVE BEFORE IT HAPPENED?  CLICK HERE To Join Our VIP ELITE GROUP  -- FREE!


Powered by 123ContactForm | Report abuse

Thursday, 14 March 2013

sp 500 index chart - latest sp 500 index chart

sp 500 index chart

The sp 500 index chart below is not moving much at all, infact we could say the market right now is producing a flat top, or in limbo (e.g. not moving much) and the bulls are trying to reach new highs. +

Remember tomorrow (FRIDAY 14th MARCH) is OPEX day and they can tend to run things up in opex weeks. However When I am trading OPEX I always expect the unexpected as over the years I have seen some rather bland action, or the opposite to that, very wild and crazy moves. Tomorrow we shall see which one we shall get. The sp 500 index chart is not really telling us too much yet! Can you feel the excitement :-P

The sp 500 index chart below shows us the market is trying to decide which way to go. The bulls and the bears are both fighting, like a tug of war, so far there is no clear winner. But we should have some more clarity in the next few days.

sp 500 index chart
sp 500 index chart


WHAT IF YOU KNEW WHICH WAY THE MARKET WAS ABOUT TO MOVE BEFORE IT HAPPENED?  CLICK HERE To Join Our VIP ELITE GROUP  -- FREE 10 Day Trial Offer Today! 

Tuesday, 19 February 2013

spx update - the latest spx update

spx update

Our VIP MEMBERS are out of the market, with some nice gains, 90pts infact. Very nice indeedy.

The markets in the next several months are in for a nice WILD RIDE I think. This happens every time we get conditions like we are seeing, so its gunna be very lucrative to those who know what they are doing, I am sure.

This is no doubt the S&P chart right now is looking very healthy. See how we bottomed with the INVERTED HEAD AND SHOULDER and now we are travelling up in a nice upwards channel, that has not been violated for now.

There are many bears out there, since 1450 screaming for a crash, however our VIP MEMBERS were able to do very well on the upside while all this screaming went on, and I have a felling there is more movements on both sides of the market to profit from.

For now, the market more bullish, but a key note here is it is very overbought, and traders who are late to the rally party do not know what to do.

spx daily chart
spx daily chart


WHAT IF YOU KNEW WHICH WAY THE MARKET WAS ABOUT TO MOVE BEFORE IT HAPPENED?  CLICK HERE To Join Our VIP ELITE GROUP  -- FREE 10 Day Trial Offer Today! 

Sunday, 3 February 2013

spx weekend update - spx weekend update and mulling

spx weekend update - spx weekend update and mulling

Over the weekend, I was looking at many charts. AI sentiment still showing us that we are in overbought territory with the S&P 500, however it does not look extreme.

As you can see we are in the sell zone, however on the line chart there is still room for us to wiggle up a bit higher. It looks like for months now the market has been creating a bearish rising wedge, and we must remember sentiment can shift however the first warning shot has not gone off yet, and it is possible we can see higher prices next week. Just a guess.

Our 1500 target has been hit :-) and the market on Friday shot up and is holding for now. The bulls still seem like they are not running out of steam just yet, so we must listen to that for now and forget the crowing roosters out there.


AI Sentiment
AI Sentiment


Taking a look at the S&P bullish percent, again we are still on a buy situation. We are up at 82.60 but there is no reason we cannot go up a bit more to ***** **VIP MEMBERS ONLY**

As you can see January has been a very good month, and very rewarding to the VIP MEMBERS


spx index
spx index


It seems the last few weeks, every man and his dog, and the so called expert pundits have been calling for a top on the market. Then the next week, more bears come out of the woodwork and call for a top again. It has not come yet! Are you starting to see a pattern here. LOL. Although this is not strange behavior, it has been quite entertaining.

Forget the pundits out there. All we need to do is read the charts for now and follow them. That has been working like gangbusters, and they will give us plenty of warning on what to expect and what actions to take next. :-)

Have a great weekend :-)

WHAT IF YOU KNEW WHICH WAY THE MARKET WAS ABOUT TO MOVE BEFORE IT HAPPENED?  CLICK HERE To Join Our VIP ELITE GROUP  -- FREE 10 Day Trial Offer Today! 

Saturday, 26 January 2013

spx weekly chart - spx weekly chart update

spx weekly chart update

Many weeks ago, we did predict the market to go up higher. (est 1500 spx)

For proof.... ==> VIEW THIS POST HERE

We were saying 1500 was coming, and believe it or not, on Friday, we got within 2 pts of that happening. LOL.


You can see below on the AI sentiment that the S&P which is obviously EXTREMELY overbought, is still on the bullish side, or has room to move higher if it wants to!


ai sentiment
ai sentiment


Taking a look at the S&P 500 daily chart, we have a 'double confirmation' the bulls are still in charge. 

1) We have an inverted head and shoulders pattern that has formed back in OCT 2012 and we broke out of this early 2013. 

2) We have broken the neckline of the inverted head and shoulders and since early JANUARY 2013 we have been travelling in a nice upwards channel, that has not yet been broken to the downside. 


spx daily chart
spx daily chart


Even in December we said not to fall in love with the downside, and that was corrrect. There were many traders caught short in early 2013. 


The summation chart is also another good market breadth indicator that gives us a good analogy on the overall sentiment of the stockmarket and indicies. Even though there are many bears who have been calling a top the last few months, the summation goes against all of these pundits, and has been clearly saying we are still in a BUY THE DIP kind of market. 


summation chart
summation chart


Yes, I understand that right now, things are overbought, and I do agree with that whole heatedly. Yes eventually the market will top out, However it is important to be patient and trade what we see, and not what we think may happen. We read charts first and trade off of them and leave emotions in the background.


WHAT IF YOU KNEW WHICH WAY THE MARKET WAS ABOUT TO MOVE BEFORE IT HAPPENED?  CLICK HERE To Join Our VIP ELITE GROUP  -- FREE 10 Day Trial Offer Today!