Web Statistics The Sentiment Trader
Showing posts with label Inverted head and shoulders. Show all posts

Friday, 7 June 2013

inverted head and shoulders pattern - CRUDE CHART

inverted head and shoulders pattern - CRUDE CHART

The crude chart is very interesting at the moment. There seems to be a larger inverted head and shoulders pattern that has formed on the chart. If we break the 97 region, it could be off to the races so to speak. This chart is being watched by alot of the analysts out there, and with the tension and riots over in the middle east right now, buyers seem to be snapping up crude at this prices.

inverted head and shoulders pattern
crude chart

WHAT IF YOU KNEW WHICH WAY THE MARKET WAS ABOUT TO MOVE BEFORE IT HAPPENED?  CLICK HERE To Join Our VIP ELITE GROUP  -- FREE!


Powered by 123ContactForm | Report abuse

Monday, 6 May 2013

inverted head and shoulders on the RUSSELL

inverted head and shoulders on the RUSSELL ?

The market has moved into a much stronger stance lately. The buyers or (bulls) have really stuck it to the bears lately and given them a real show.

Maybe every man and his dog was talking about the SELL IN MAY phenomenon and the bulls got sick of that, and thought to themselves...."lets give those bears a real run for their money" Well that is exactly what has happend!

We will however let the charts do the talking for now. You can see on the RUSSELL 2000 daily chart below that there is a pattern that other traders out there are not seeing. Not only has an inverted head and shoulders pattern presented itself, we have broken out of the neckline area of 950. This means, the bulls are not only giving the bears a run for their money, but now in an area where more sell stops could start to trigger and send the market up even higher.

inverted head and shoulders


WHAT IF YOU KNEW WHICH WAY THE MARKET WAS ABOUT TO MOVE BEFORE IT HAPPENED?  CLICK HERE To Join Our VIP ELITE GROUP  -- FREE 10 Day Trial Offer Today!


Powered by 123ContactForm | Report abuse


For all other enquiries ==>  CLICK HERE TO CONTACT US


Saturday, 26 January 2013

spx weekly chart - spx weekly chart update

spx weekly chart update

Many weeks ago, we did predict the market to go up higher. (est 1500 spx)

For proof.... ==> VIEW THIS POST HERE

We were saying 1500 was coming, and believe it or not, on Friday, we got within 2 pts of that happening. LOL.


You can see below on the AI sentiment that the S&P which is obviously EXTREMELY overbought, is still on the bullish side, or has room to move higher if it wants to!


ai sentiment
ai sentiment


Taking a look at the S&P 500 daily chart, we have a 'double confirmation' the bulls are still in charge. 

1) We have an inverted head and shoulders pattern that has formed back in OCT 2012 and we broke out of this early 2013. 

2) We have broken the neckline of the inverted head and shoulders and since early JANUARY 2013 we have been travelling in a nice upwards channel, that has not yet been broken to the downside. 


spx daily chart
spx daily chart


Even in December we said not to fall in love with the downside, and that was corrrect. There were many traders caught short in early 2013. 


The summation chart is also another good market breadth indicator that gives us a good analogy on the overall sentiment of the stockmarket and indicies. Even though there are many bears who have been calling a top the last few months, the summation goes against all of these pundits, and has been clearly saying we are still in a BUY THE DIP kind of market. 
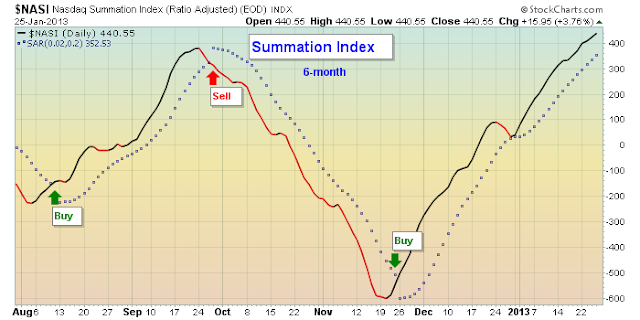

summation chart
summation chart


Yes, I understand that right now, things are overbought, and I do agree with that whole heatedly. Yes eventually the market will top out, However it is important to be patient and trade what we see, and not what we think may happen. We read charts first and trade off of them and leave emotions in the background.


WHAT IF YOU KNEW WHICH WAY THE MARKET WAS ABOUT TO MOVE BEFORE IT HAPPENED?  CLICK HERE To Join Our VIP ELITE GROUP  -- FREE 10 Day Trial Offer Today! 

Saturday, 5 January 2013

Inverted head and shoulders - a inverted head and shoulders

Inverted head and shoulders ?

Today lets do some pure Technical analysis and measurements on the S&P 500 chart.

The holiday reversals at the end of December we skidded down but I will still class this at the bottom of the right shoulder of the inverted head and shoulders.

So we have the bottom of the head and shoulders at about the 1340 level. If take the measured move from the bottom of the head to the neckline, and double that over, we are up around the 1495 - 1500 level. Possibly higher.

We have already broken the neckline, and broken it very convincingly! So it will be interesting what happens in the next week or so.

The weekly chart on the daily if you zoom back is also asking for the 1490 - 1500 level. So that is giving us a double confirmation we might see these levels.

The smart money is now back in the market, and they were not short. The novice retails traders who traded through xmas were short, and it was the wrong move to make.

As you can see on the chart below, what a difference 2 or 3 days make on the market.

Inverted head and shoulder patterns do not always work out, but when they do, its a real sight to see. So now we have a double confirmation we will wait and see what happens. :-)


inverted head and shoulders
WHAT IF YOU KNEW WHICH WAY THE MARKET WAS ABOUT TO MOVE BEFORE IT HAPPENED?  CLICK HERE To Join Our VIP ELITE GROUP  -- FREE 10 Day Trial Offer Today!