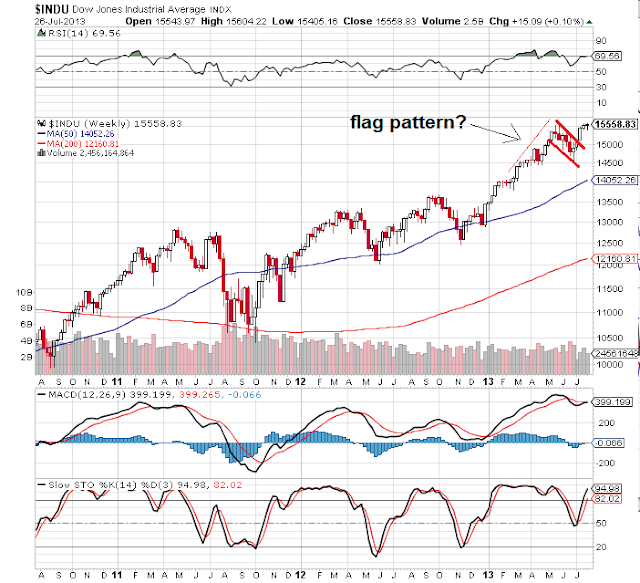
Top callers and those shorting this market, but be very frustrated right now. The DOW JONES WEEKLY CHART Below is show how strong and resilient this market is. You do not even have to guess when you look at the weekly chart.
The last major dip on the market seems to have just created another bullish flag we have now broken out of. I do agree this market is a little overbought, but I have been getting emails from my readers since the DOW was at 12,000 trying to convince me the market was topping out and a crash was coming. So far we have not seen that at all. It is better to let the charts do the talking for now, and right now they keep telling us a different story.
Eventually we will get to major extremes in the market, but the market can remain in extremes longer then anyone can imagine. Better to trade what you see today, not what you expect to happen tomorrow.
WHAT IF YOU KNEW WHICH WAY THE MARKET WAS ABOUT TO MOVE BEFORE IT HAPPENED? CLICK HERE To Join Our VIP ELITE GROUP -- FREE!
Powered by 123ContactForm | Report abuse


No comments:
Post a Comment