Web Statistics The Sentiment Trader
Showing posts with label market technical analysis. Show all posts

Thursday, 24 October 2013

Pennant Pattern

Pennant Pattern

Pennant Pattern on the S&P ?

When you look at the daily chart it seems most the action this week has just been coiling for maybe higher prices coming soon.

WHY?

There is what I would be calling a PENNANT on a POLE on the S&P chart right now and normally these patterns precede higher prices on the charts. We shall see, check out the chart below.


pennant pattern
pennant pattern


WHAT IF YOU KNEW WHICH WAY THE MARKET WAS ABOUT TO MOVE BEFORE IT HAPPENED?  CLICK HERE To Join Our VIP ELITE GROUP  -- FREE!


Powered by 123ContactForm | Report abuse

Tuesday, 1 October 2013

nasdaq chart update

nasdaq chart update

As you can see below, the nasdaq chart is currently in an upwards channel. It did try to break but was unsuccessful.

We have warned many times not to fall in love with the downside, and as you can see on this chart, even if we do get a dip this market seems to countless times in 2013 just want to head higher.

nasdaq daily chart
nasdaq daily chart


Managed funds and investment managers are up something like 13% in 2013 so far. That is one of the highest records in years! our VIP members (below) have certainly done well and it has been a fun year. And the year is not even done yet. HURRAY!


WHAT IF YOU KNEW WHICH WAY THE MARKET WAS ABOUT TO MOVE BEFORE IT HAPPENED?  CLICK HERE To Join Our VIP ELITE GROUP  -- FREE!


Powered by 123ContactForm | Report abuse

Tuesday, 10 September 2013

Market Update - Video Analysis 11th September

A little bag of goodies to help you trade in this crazy market! 

WATCH the latest Market Update Video Below.

Market Update - Video Analysis 11th September


=======================================================
BLOCKED CONTENT HERE  -  PREMIUM VIP MEMBERS ONLY! 
(VIP Subscription Details Below)
=======================================================
=======================================================================

How Can I Join Sentiment Trader's Premium ELITE VIP Membership with FULL ACCESS?


Sentiment Trader's premium ELITE VIP Membership with Chip is a Sunday through Thursday evening extended membership, which include charts, news, data & video also. Chip disects the Futures, and Stock market. If you're a new member you can join the premium ELITE membership for a 30 Day test drive BELOW for  -  ONLY  $1.99

Offer Is Valid for New Members Only


Friday, 23 August 2013

Dow Weekly Update

Dow Weekly Update

The last few weeks on the market have been interesting, with a sell signal on the weekly chart, the bears have come back with a real biting attitude and they want to teach the bulls a lesson. The main concern for me is that we have broken a longer term rising support line (and channel) and this week we closed below it. That is a real thorn in the side for the bulls, however when you zoom back to 2010 just like we have on the chart below you can see this is still a bull market, and we have had sell offs along the way, however they only last a few weeks. So we could be in this process of back and filling again! :-)

Right now we have had 3 red weeks on the candlestick chart below and we are in a  TREAD CAREFULLY stance on the market. A close below this rising support line is not good, however it seems there could be lower prices coming sometime in SEPTEMBER 2013 and that might make sense as every man and his dog is awaiting the federal reserve Tapering news to see if they are going to start withdrawing the billions of dollars they are flooding the market with. My own personal opinion is it will not really matter if the tapering is a small percentage, investors will probably just get on with it and realize it is not the end of the world....however, we expect there to be a little bit of nervousness leading up to this FED Announcement which will occur on the 17th & 18th of SEPTEMBER.... I like the analogy that some analysts out there are calling it SEPT-APER! Very clever, but I must confess not matter what announcement may come, the charts always come first.

Right now the charts below are hinting at lower prices, but even if that does occur in the next few  months, I would not go falling in love with the downside, that is for sure. The bears do have chance to do some damage here or in the next few weeks, but how much we will have to wait and see!?

Dow Weekly Update
Dow Weekly Update


WHAT IF YOU KNEW WHICH WAY THE MARKET WAS ABOUT TO MOVE BEFORE IT HAPPENED?  CLICK HERE To Join Our VIP ELITE GROUP  -- FREE!


Powered by 123ContactForm | Report abuse

Sunday, 28 July 2013

Dow Jones Weekly Chart

Dow Jones Weekly Chart

Top callers and those shorting this market, but be very frustrated right now. The DOW JONES WEEKLY CHART Below is show how strong and resilient this market is. You do not even have to guess when you look at the weekly chart.

The last major dip on the market seems to have just created another bullish flag we have now broken out of. I do agree this market is a little overbought, but I have been getting emails from my readers since the DOW was at 12,000 trying to convince me the market was topping out and a crash was coming. So far we have not seen that at all. It is better to let the charts do the talking for now, and right now they keep telling us a different story.

Eventually we will get to major extremes in the market, but the market can remain in extremes longer then anyone can imagine. Better to trade what you see today, not what you expect to happen tomorrow.


WHAT IF YOU KNEW WHICH WAY THE MARKET WAS ABOUT TO MOVE BEFORE IT HAPPENED?  CLICK HERE To Join Our VIP ELITE GROUP  -- FREE!


Powered by 123ContactForm | Report abuse

Tuesday, 2 July 2013

greendot corp

greendot corp

The greendot corp chart below is a chartists dream!

What else can I say about it. Even though the market has felt real pressure over the last few months, this company has been traveling along nicely and the chart, well just take a look at it below! This has been travelling up in a beautiful upwards channel. This is a chart to keep a close eye on in the coming months.

Code : GDOT

greendot corp
greendot corp


WHAT IF YOU KNEW WHICH WAY THE MARKET WAS ABOUT TO MOVE BEFORE IT HAPPENED?  CLICK HERE To Join Our VIP ELITE GROUP  -- FREE!


Powered by 123ContactForm | Report abuse

Friday, 28 June 2013

Market Update 29th June 2013

The Fed Tapering News Is Really causing some havoc with the market. I Explain why in the VIDEO below.

WATCH the Latest Market Update Video Below.

Market Update - Video Analysis 29th June
 

=======================================================
BLOCKED CONTENT HERE  -  PREMIUM VIP MEMBERS ONLY! 
(VIP Subscription Details Below)
=======================================================
=======================================================================

How Can I Join Sentiment Trader's Premium ELITE VIP Membership with FULL ACCESS?


Sentiment Trader's premium ELITE VIP Membership with Chip is a Sunday through Thursday evening extended membership, which include charts, news, data & video also. Chip disects the Futures, and Stock market. If you're a new member you can join the premium ELITE membership for a 30 Day test drive BELOW for  -  ONLY  $1.99

Offer Is Valid for New Members Only


Wednesday, 26 June 2013

put call data

As you can see below, the put call data is telling us 2 things.

1)  There are lots of people thinking this is a bottom on the market, as people have been buying calls - or betting the market will go considerable higher from here. 

2) The bulls have not got enough power to give us a  nice bounce on the market. 

It seems the bulls have lost their mojo here, and we are thinking the market is still feeling pressure here.

put call data
put call data


WHAT IF YOU KNEW WHICH WAY THE MARKET WAS ABOUT TO MOVE BEFORE IT HAPPENED?  CLICK HERE To Join Our VIP ELITE GROUP  -- FREE!


Powered by 123ContactForm | Report abuse

Tuesday, 25 June 2013

The Dow Jones Trannies Breadth Chart

We are in T+3 today, and the terminal read shows that the smart money marks up their winners, and dumps their losers today.  
 
big imbalances on the sell side.

Looking at the market breadth of the dow jones transports or the leader of the market you can see the smart money is heading for the exits or has been selling recently. So for those of you who are thinking the market is out of trouble right now, this chart is telling us that that is not the right way to think at the moment.

The market does face some head winds at the moment, and there is alot of data coming out of china, or china focused this week. That could keep the market nervous, as China is in fear of a potential credit crunch at the moment. But we forget the news right now and just study our charts, as they are very telling at the moment, and this one is a good one to go by.


djta chart
djta chart


WHAT IF YOU KNEW WHICH WAY THE MARKET WAS ABOUT TO MOVE BEFORE IT HAPPENED?  CLICK HERE To Join Our VIP ELITE GROUP  -- FREE!


Powered by 123ContactForm | Report abuse

Saturday, 22 June 2013

spx weekly chart - what does it tell us

This is another favourite chart to watch amongst our  VIP MEMBERS HERE

As you have noticed we have been watching the weekly SPX chart very carefully! You have to love this chart if you are a trader, small or large as it really shows the power and how much the government has kept the markets afloat with their bullshit printing off of money.

"Hey you, check out this money we just printed, lets chuck it in the market!"

That is an awesome idea.....NOT! :-P

I can sit here all day and tell you how stupid the government is, and how much they love to work against you in your day to day life.....can you say *cough* Edward Snowden *cough*  haha. LOL.

Yes I can ream on all day about the government, but realistically I wont waist my time because it will not help you make money on the market.

Back to the charts : So in laymens terms the weekly chart has  now busted out of a nice rising channel it has been in since DECEMBER 2012. The stochastics and macd are also on a sell signal right now, so we have a big warning sign the market is about to hit the skids some more and a more down could be on the way in the next several weeks.

Even if we do see more profit taking and selling off, I would not go falling in love with the downside.

Yes the market does have some downside work to do, infact there could be some more violent selling off, but again, there are too many people screaming for a crash to 666 on the S&P. Now I am not saying that wont happen, but that is a low probability is all. I have posted many charts here in the blog that confirm we are still in a bull market. And we have to remember that bull markets do not go up in a straight line, that is for sure.

Looks like with the action we have seen in the last two weeks, we are going to have a very volatile summer on our hands. For some this will be great, and I love trading in this environment, but for others, they will get chopped up and lose their accounts. So you have been warned.
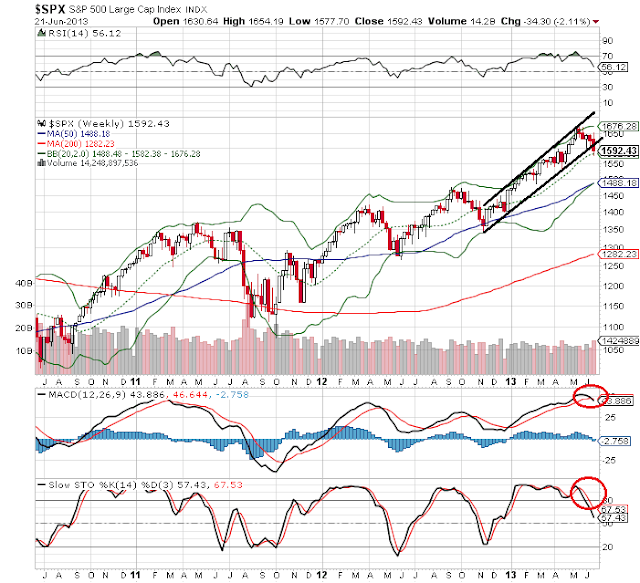

spx weekly chart
spx weekly chart


WHAT IF YOU KNEW WHICH WAY THE MARKET WAS ABOUT TO MOVE BEFORE IT HAPPENED?  CLICK HERE To Join Our VIP ELITE GROUP  -- FREE!


Powered by 123ContactForm | Report abuse

Thursday, 20 June 2013

S and P In trouble.

We hinted a few days ago that the S&P could be forming a bearish flag. These patterns have about a 80% chance of playing out in technical analysis terms. This did in fact play out, and the market is now in serious trouble.

The bottom of the bearish flag broke today, and skidded down to the 1580 level. We have bounced a bit, however as you can see on the chart, things do not look too good for the S&P right now.

If the bears come out in droves, we could see 1550 come soon, and maybe even lower, but the target off that flag is about the 1550 - 1560 level. Time will tell.


S&P broke bearish flag


WHAT IF YOU KNEW WHICH WAY THE MARKET WAS ABOUT TO MOVE BEFORE IT HAPPENED?  CLICK HERE To Join Our VIP ELITE GROUP  -- FREE!


Powered by 123ContactForm | Report abuse

Saturday, 15 June 2013

Market Update 16th june 2013

A little bag of goodies to help you trade in this crazy market! 

WATCH the latest Market Update Video Below.

Market Update - Video Analysis 16th June


=======================================================
BLOCKED CONTENT HERE  -  PREMIUM VIP MEMBERS ONLY! 
(VIP Subscription Details Below)
=======================================================
=======================================================================

How Can I Join Sentiment Trader's Premium ELITE VIP Membership with FULL ACCESS?


Sentiment Trader's premium ELITE VIP Membership with Chip is a Sunday through Thursday evening extended membership, which include charts, news, data & video also. Chip disects the Futures, and Stock market. If you're a new member you can join the premium ELITE membership for a 30 Day test drive BELOW for  -  ONLY  $1.99

Offer Is Valid for New Members Only