Well we were saying the range on the S&P should be watched carefully, and said it was not long till we broke either upside or downside.
You can see in our LAST POST HERE
We broke to the upside, however I would not call it a convincing break!. The bulls yet again still have the upper hand I think. We are still up past our 1500 level we called months ago, and still the bears do not seem to be making their mark.
Yes, we are still in a bull market, however I can say to you that we are starting to see some very interesting signals on the charts, and a few warning signs that market may soon get a bit tired.
WHAT IF YOU KNEW WHICH WAY THE MARKET WAS ABOUT TO MOVE BEFORE IT HAPPENED? CLICK HERE To Join Our VIP ELITE GROUP -- FREE 10 Day Trial Offer Today!
The Sentiment Trader - "Follow the smart money and learn how to take consistent profits from the market each month".
Showing posts with label upside. Show all posts
Saturday, 9 February 2013
Tuesday, 29 January 2013
Dow Jones Transports Chart - Strong Dow Jones Transports Chart
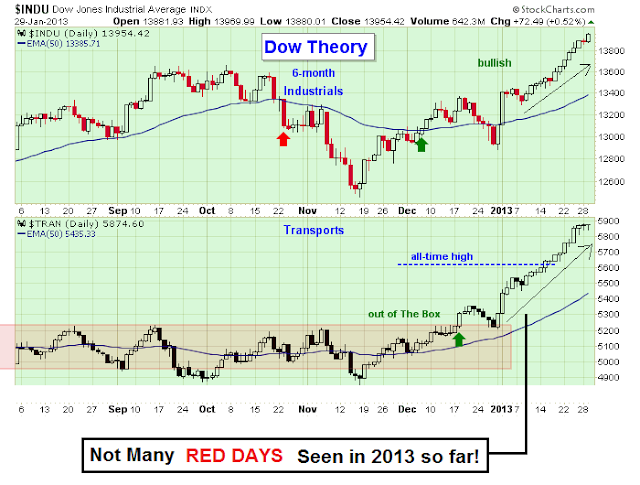
Have a look at the dow jones transports chart below.
What we have noticed is that our breadth indicator charts have been spot on, as on the chart below, the dow jones trasports chart is showing us that we have hardly even seen one red day on the market this year. WOW!
Over $44 billion dollars has been put into work on the market since the 1st of January, and as you can see they want to put this money to work, or make it work for them (as they say)
We said at the start of the year, DO NOT FALL IN LOVE WITH THE DOWNSIDE, and now you can see why!.
The DOW JONES TRANSPORTS CHART does look strong, and yes, a top will come soon, however we just look and read charts first, and the dow jones transports chart below is still looking very bullish.
WHAT IF YOU KNEW WHICH WAY THE MARKET WAS ABOUT TO MOVE BEFORE IT HAPPENED? CLICK HERE To Join Our VIP ELITE GROUP -- FREE 10 Day Trial Offer Today!
What we have noticed is that our breadth indicator charts have been spot on, as on the chart below, the dow jones trasports chart is showing us that we have hardly even seen one red day on the market this year. WOW!
Over $44 billion dollars has been put into work on the market since the 1st of January, and as you can see they want to put this money to work, or make it work for them (as they say)
We said at the start of the year, DO NOT FALL IN LOVE WITH THE DOWNSIDE, and now you can see why!.
The DOW JONES TRANSPORTS CHART does look strong, and yes, a top will come soon, however we just look and read charts first, and the dow jones transports chart below is still looking very bullish.
![]() |
| dow jones transports chart |
The vix chart below is showing us that it has been very suppressed lately and has struggled to find a bid. As you know the VIX is the inverse trade to the S&P and stock market, it has given the bulls just what they need to keep the market bullish and to keep that $44 billion dollars (we mentioned above) hard at work!!!!!!
Over the last few weeks, the VIX has tested the 14 level, and failed to get above, which has been helping the bulls.
![]() |
| vix daily chart |
WHAT IF YOU KNEW WHICH WAY THE MARKET WAS ABOUT TO MOVE BEFORE IT HAPPENED? CLICK HERE To Join Our VIP ELITE GROUP -- FREE 10 Day Trial Offer Today!
Subscribe to:
Posts (Atom)


