Web Statistics September 2012

Sunday, 30 September 2012

As Fiscal Cliff Nears, Markets Ponder a Rougher Ride

As Fiscal Cliff Nears, Markets Ponder a Rougher Ride

Markets Ponder a Rougher Ride in the coming months I think. The warning signs are already there if you look at what has been happening in the markets the last few weeks.

If you have a look at the NASDAQ we have broken significant support in the upwards channel, but we have not dropped dramatically at all.

As Fiscal Cliff Nears, Markets Ponder a Rougher Ride

It is my opinion that the markets are really just waiting to see what happens in the up and coming election.  I doubt they are going to let the market sell off hard when congress are rallying and Obama's reputation is at stake. That will not make him look good at all. Any astute investor knows that it is common for the markets to hold ground every 4 years whenever there is a presidential election occuring, so this year could be the same. 

Another factor that we must consider is that there has been so much talk lately of the bad economic conditions, that any more bad news could be priced into the market. 

As Fiscal Cliff Nears, Markets Ponder a Rougher Ride, because the bigger financial changes coming are going to shock many people soon. I think those who are awake know something is coming, However people are looking for more evidence to back up their sneaking suspicions. 

Statistically the market tends to rise after US elections are over, and The fact that QE3 has been announced, is going to make things very interesting in the coming weeks.

WHAT IF YOU KNEW WHICH WAY THE MARKET WAS ABOUT TO MOVE BEFORE IT HAPPENED?  CLICK HERE To Join Our VIP ELITE GROUP  -- 30 Day Trial Offer Today!  

Saturday, 29 September 2012

One Happy Subscriber

A very relaxing Sunday this end :-) . I went to check my GMAIL this morning and to my delight had a very nice, positive email from one of our ELITE subscribers! WOW!

With Ben's permission I thought I would share it with you here.....


All I can say is WOW! 33% is pretty darn good!!!!

No one ever said this trading thing was EASY, but I love to hear about these sort of stories. Thanks BEN, and well done. 

To all the others, have a great weekend, I will try to post an UPDATE on MONDAY!


WHAT IF YOU KNEW WHICH WAY THE MARKET WAS ABOUT TO MOVE BEFORE IT HAPPENED?  CLICK HERE To Join Our VIP ELITE GROUP  -- 30 Day Trial Offer Today!    

Thursday, 27 September 2012

silver predictions 2013

silver predictions 2013 - silver predictions 2013 you don't want to miss

When you look at what is happening at the end of 2012 the economy is failing badly. No matter what the government keep telling you, the economy is not getting better, in fact its much much worse than that, and I have posted many of my thoughts regarding the economy. The price of gold and silver have done well recently, they always do well (historically) when the economy is struggling as they are seen as a safe haven.

Silver and my silver predictions 2013 might interest you if you are an astute commodity trader.

The look on this kids face below says it all. If you have a look at the chart below the prices of silver have been going up quite significantly. In just the last few weeks silver has gone from $28 to $35. A very solid move! Right now as you read this silver is trading at $34.80 and I think the next target in silver is about $38 .... then we could go even higher!!!


silver predictions 2013


Going off the technicals in this chart, we could even see $65 to $70 dollars in silver soon, but will probably have to wait till 2013 for that to happen. Just a guess.

I think the final price of Silver depends also how much more stimulus comes from central banks but I believe they come up with more electronic printing soon! Surprise, surprise! LOL. I also believe that Silver will be charged higher VAT so this is going to be a fun thing to watch also, market my words!

There are my silver predictions 2013, I am not saying we just shoot up from here, but defiantly keep an eye on this little gem in the coming months.  The weekly and monthly charts in silver look absolutely AMAZING!


WHAT IF YOU KNEW WHICH WAY THE MARKET WAS ABOUT TO MOVE BEFORE IT HAPPENED?  CLICK HERE To Join Our VIP ELITE GROUP  -- 30 Day Trial Offer Today!    

Bouncy Bouncy Bouncy!


Well, Say hello to the end of the 3rd Quater …

It seems the mutual funds sell S&P down on Monday, Tuesday, Wednesday and then we rally Thursday and Friday.

It is just a guess, but alot of the smart money was probably marking up the winners today ;)


I have zoomed back on the S&P chart to show you what happened the last few weeks, we seem to be bouncing off OLD resistance highs that were made way back in APRIL 2012. That is very interesting!


I posted USD charts yesterday explaining what was happening in the USD HERE and its line in the sand move!  It is very interesting, and I would keep watching the USD for signs of what  the market does in the short term. 

The chart above still proves the bulls have not lost their swagger just yet ;-)

Happy trading. 

WHAT IF YOU KNEW WHICH WAY THE MARKET WAS ABOUT TO MOVE BEFORE IT HAPPENED?  CLICK HERE To Join Our VIP ELITE GROUP  -- 30 Day Trial Offer Today!    

Wednesday, 26 September 2012

Line In The Sand - The USD and line in the sand

Line In The Sand - The USD and line in the sand

Our VIP ELITE GROUP have been going gangbusters lately. I did want to post something in the FREE section here.

What I did notice today is that the US Dollar is that is is coming up to the line in the sand here. Currently trading at 79.82 the real line in the sand (or falling resistance line points) is about the $80 level. If it can break through this level the S&P is NOT going to like that, and it will create more selling. However, if the USD fails to get back past this $80 level, then the S&P which has been Bullish lately will find even more support and we will shoot higher.

I am also here, to remind you that the QE3 buying starts on friday, so it is my opinion that things will be volatile around then and you will have to be on your toe. But for now, watch that USD chart...its quite telling. 

Happy Trading :-)


WHAT IF YOU KNEW WHICH WAY THE MARKET WAS ABOUT TO MOVE BEFORE IT HAPPENED?  CLICK HERE To Join Our VIP ELITE GROUP  -- 30 Day Trial Offer Today!    

Bonds Building - Market Still Tired

Well another red day on the market as we hinted at in the ( VIP ELITE GROUP HERE )

After a few weeks of bonds being very messy, alot of the bonds traders are jumping for joy as the chart has cleaned up a bit. Have a look at the weekly chart on BONDS below. It seems to be forming a bullish flag at the moment. It has not broken yet, and is only "looking" like a bullish flag, because it must break out of this pattern first for more buying to come in. That will put even more pressure on the market.


With the strength in bonds, the market (nasdaq) has now broken out of its upwards channel and the bottom resistance line, and continued down today on WEDNESDAY. If we look back it is obvious that we have not see 3 or 4 down HEAVY down days in a row, so my guess is that the bears still have the upper hand, but there will might be some sort of bounce coming, but we will probably have to wait till next week to see this happen, and also see how bad the bulls want it! :-)


The sentiment right now is still with the bears, and our breadth indicators are confirming that. Happy trading :-)

WHAT IF YOU KNEW WHICH WAY THE MARKET WAS ABOUT TO MOVE BEFORE IT HAPPENED?  CLICK HERE To Join Our VIP ELITE GROUP  -- 30 Day Trial Offer Today!    

Tuesday, 25 September 2012

Bears Won Today

Well the bears had a ball today! As was expected the Transports have been leading the charts and warning us that a day like this was in the works for weeks now. So I am not surprised.

Have a look at the hourly chart on the S&P it was pretty much a bearfest day from start to finish!!


With the TRIN over 2, and tick heading to the oversold area, I do think that ( Level For VIP MEMBERS ONLY ) level is coming very soon.  But patience is required.


On the daily chart the S&P is still within the upwards channel, but after today we zoomed back down and stopped right at the bottom of the rising channel. So now we are at a make or break level. The next few days will be interesting!!!!


WHAT IF YOU KNEW WHICH WAY THE MARKET WAS ABOUT TO MOVE BEFORE IT HAPPENED?  CLICK HERE To Join Our VIP ELITE GROUP  -- 30 Day Trial Offer Today!    

Monday, 24 September 2012

More Bank Layoffs Coming: 'Bad as I've Seen It': Whitney

More Bank Layoffs Coming: 'Bad as I've Seen It': Whitney

It seems they are predicting more bank layoffs soon. I think it is a joke that some analysts out there are saying the economy is 'getting stronger', or 'recovering'. If you walk down the street and ask any hard working Mom or Dad just exactly what is going on in their house. The answer will surprise you. Yet the two biggest morons in the world, OBAMA and ROMNEY battle it out, and talk about how they are better than the other moron, will strengthen the economy, while billions of dollars are pumped into the election campaigns. Anyone else see the problem there?? Errrr, well, ok....don't get me started!!! LOL. :P

Anyway, in our last post here, we hinted the DOW JONES TRANNIES (or the leader of the market) was not looking too healthy at all. There was increased selling volume while it started selling off. That was a good warning sign. Today the trannies broke out of what I would call a pennant, and then bounced, back to the support of the pennant pattern. The weakness did roll on over to the follows S&P and other indicies as well.


WHAT IF YOU KNEW WHICH WAY THE MARKET WAS ABOUT TO MOVE BEFORE IT HAPPENED?  CLICK HERE To Join Our VIP ELITE GROUP  -- 30 Day Trial Offer Today!    

Saturday, 22 September 2012

The Leader Of The Market

The leader of the market or the DJTA (Dow Jones Transportation Average) is quite interesting here. I always watch this for clues about where the market could head next, as it can give us many good signs.

If you have a look at the DJTA chart below, we have basically be trading within a range for the last few months ( 87 - 93 ) and things have just been bouncing  in a rectangle range, while the market was skidding higher. As you can see on the chart I have circled the DJTA sold off back down to its short term support levels, and as it sold off, and the sell off volume on THURS & FRI was quite significant.

The price also poked its head just below the significant levels of support too, by the close on FRIDAY. So it means the DJTA is warning us a bit here.


WHAT IF YOU KNEW WHICH WAY THE MARKET WAS ABOUT TO MOVE BEFORE IT HAPPENED?  CLICK HERE To Join Our VIP ELITE GROUP  -- 30 Day Trial Offer Today!    

Thursday, 20 September 2012

OPEX FRIDAY AWAITS US

Well I woke up today and had a few things to attend to, so I will post a quick update for FRIDAY OPEX. 

Thursday played out quite well and we have been killing it in (VIP SECTION HERE)


The last 8 of 9 opex have been positive days, and there is a bullish swing day setting up on the charts...so it would not surprise me if we see some more up or follow through on FRIDAY! We shall see????

What I do want to mention quickly is the the bonds really took my fancy today as the 60 minute chart broke an important uptrend, plus you zoom back to the daily chart and we seem to be putting in a bearish flag pattern. That for me is very interesting and confirming my thoughts on the S&P in the short term. Make sure you watch bonds as it is giving a heads up I think. :-) 

BONDS CHART
Happy Trading! :-)


WHAT IF YOU KNEW WHICH WAY THE MARKET WAS ABOUT TO MOVE BEFORE IT HAPPENED?  CLICK HERE To Join Our VIP ELITE GROUP  -- 30 Day Trial Offer Today!    

presidential election and stock market

presidential election and stock market comparisons is what I wanted to show you today.

presidential election and stock market prices do have some VERY eery similarities over the years and that is why many smart analysts have presidential election and stock market comparisons on their watch lists this year in 2012 as OBAMA is trying to get back into office in November, which is in just a few months.

Have a look at this chart below.

presidential election and stock market Chart

presidential election and stock market

presidential election and stock market Best in Four-Year-Cycle: It is no mere coincidence that the last two years (pre-election year and election year) of the 44 administrations since 1833 produced a total net market gain of 718.5%, dwarfing the 273.1% gain of the first two years of these administrations

Presidential elections every four years have a profound impact on the economy and the stock market. Wars, recessions and bear markets tend to start or occur in the first half of the term; prosperous times and bull markets, in the latter half. After nine straight annual Dow gains during the millennial bull, the four-year election cycle reasserted its overarching domination of market behavior the last 11 years. However, 2008 was the worst presidential election year on record.

Only Two Losses In Last Seven Months Of Election Years: Regardless which Party is victorious, the last seven months have seen gains on the S&P 500 in 13 of the 15 presidential election years since 1950. One loss was in 2000 when the election's outcome was delayed for 36 tumultuous days, though the Dow did gain ground in the last seven months of 2000. Financial crisis and the worst bear market since the Great Depression impacted 2008.

First Five Months Better When Party Retains White House: Since 1901 there have been 27 presidential elections. When the Party in power retained the White House 16 times, the Dow was up 1.5% on average for the first five months, compared to a 4.6% loss the 11 times the Party was ousted. Since 1950, retaining the White House 7 times brought an average gain of 1.9% compared to –0.1% the other 8 times.

War Can Be A Major Factor In Presidential Races: Democrats used to lose the White House on foreign shores (1920 WW1, 1952 Korea, 1968 Vietnam, 1980 Iran Crisis). Republicans on the other hand lost it here at home (1912 Party split, 1932 Depression, 1960 Economy, 1976 Watergate). Homeland issues dominated elections the last three decades with the Republican loss in 1992 (Economy), and the Democratic loss in 2000 (Scandal), and the Republican loss in 2008 (Economy). As we've learned over the years, it all depends on who the candidates are in 2012.

Market Bottoms Two Years After A Presidential Election: A takeover of the White House by the opposing party in the past 50 years (1960, 1968, 1976, 1980, 1992, 2000, 2008) has resulted in a bottom within two years, except 1994, a flat year. When incumbent parties retained power (1964, 1972, 1984, 1988, 1996, 2004) stocks often bottomed within two years later as well, except 1984 (three years, 1987) and 2004 (one year, flat 2005). Whatever the outcome in 2012, we could see a bottom by 2014.

Only Six Election Year Declines Greater Than 5% Since 1896: Presidential election years are the second best performing year of the four-year cycle. Incumbent parties lost power in five of the six years with declines greater than 5%. Five losses occurred at the end of the second term. FDR defeated Hoover in 1932 and was re-elected to an unprecedented third term as WWII ravaged Europe. Election year 2012 marks the end of the incumbent party’s first term, improving the prospects for a solid year.

WHAT IF YOU KNEW WHICH WAY THE MARKET WAS ABOUT TO MOVE BEFORE IT HAPPENED?  CLICK HERE To Join Our VIP ELITE GROUP  -- 30 Day Trial Offer Today!      

Wednesday, 19 September 2012

What the tick is saying?

What is the tick reading saying?

This is what we normally talk about in  OUR VIP ELITE GROUP HERE but I thought I would post it up for you here today.


On the 18th, which was yesterday the tick reading went right down into the -150 zone which is seen as  being quite an oversold area, but then later in the day it actually flipped back to a buy signal. Looking at this tick reading indicator, and also the S&P 500 It would be astute to assume the market is going to see some sort of buying in the next day or so. 

We shall see what happens in the next day or so. But we are at a very interesting point in the market.

Happy trading :-)


WHAT IF YOU KNEW WHICH WAY THE MARKET WAS ABOUT TO MOVE BEFORE IT HAPPENED?  CLICK HERE To Join Our VIP ELITE GROUP  -- 30 Day Trial Offer Today!     

Tuesday, 18 September 2012

hanging tough - nasdaq chart

If we have a look at the NASDAQ chart it seems to be hanging tough at the moment. 

The top callers are still convinced we are about to sell off hard here, but I must tell you a few important things right here.  The market has been sideways / or lagging a bit, I will give the bears that, however the market remains very quiet in the JEWISH holidays. 

When you discount all the large computer program trading that has been occurring since Monday, the volume on the market has dried right up. 

I think the hedge funds are concentrating the SEPT and quarterly expiriations this week. By the end of this week, they will be getting their portfolios ready for Q4. The 4th quarter I might add is the best time to trade. I love the Q4 time on the market, lots of volatility normally and a good time to be a trader. 

While I do think the bears have had the upper hand these last few days on the market, it has not convinced me that they have the gonads to keep the market suppressed going into Friday and the September expirations. 

The seasonality we have been giving our VIP ELITE GROUP has been working a treat these last few days. Awesome stuff. 

Happy trading :-)

WHAT IF YOU KNEW WHICH WAY THE MARKET WAS ABOUT TO MOVE BEFORE IT HAPPENED?  CLICK HERE To Join Our VIP ELITE GROUP  -- 30 Day Trial Offer Today!      

Monday, 17 September 2012

bearish chart patterns

bearish chart patterns ?

I have to say there is a lot of extreme negativity and bearish sentiment out there at the moment. But if we have a look at the nasdaq chart what does it tell us.


Here are some important points to remember...

1) Since the end of JULY we have been trading in a nice upwards channel. Which means we have been seeing higher lows and higher highs. It means sentiment is bullish right now and not bearish like some are suggesting!

2) The QE3 announcement was only released days ago. This was one of the most major news items for 2012 and thus still takes several days for the hype and hysteria to dissipate.

3) We enter OPEX (or options expiry) week this week, which normally has a tenancy to show strength and bias to the upside


There are many sell indicators now lining up on the charts and global indicies, we must remember the one simple rule of technical analysis, which states "THE TREND IS YOUR FRIEND UNTIL THE VERY END!"

When you see a chart like the NASDAQ above, that goes from the bottom left to the top right, that is not a bearish chart in my view, no matter how many amateur traders, go around kicking and screaming and swearing on their mother's grave that this is the top. Yes, eventually there will be a top, but why jump to conclusions here when we have no real evidence huh?

So lets hang tight and take each day as it comes, sit back and trade what you see, not what others are telling you, or base your trades on what you think "MIGHT" happen next. That is the fastest way to lose money and blow up your account. 

bearish chart patterns setting up. Well there is no evidence just yet, the best thing to do is be patient and see what we get. It will be an interesting week. Happy trading :-)


WHAT IF YOU KNEW WHICH WAY THE MARKET WAS ABOUT TO MOVE BEFORE IT HAPPENED?  CLICK HERE To Join Our VIP ELITE GROUP  -- 30 Day Trial Offer Today!      

Saturday, 15 September 2012

Fed Juices Stocks—but What Could Bring Out the Bears?

Fed Juices Stocks—but What Could Bring Out the Bears?

Well I will tell you. There are many things going on right now, that you can guess on, but do not know the full extent of its damage.

Fed Juices Stocks all they like, but realistically that is not really the main concern. The real concern is what is happening out there in the real economy and how that can effect that market.

Right now if you have a look at the S&P 500 we are at chasing things up quickly. We are still in a channel and right on resistance. 


Also if you take a look at another market sentiment indicator, the NA5OR indicator which is saying things are not only at overbought levels they are at extremes.


It would be fair to say things are at over extremes right now, and greed is at an all time high. That normally means, that a sell off can happen anytime! I am not saying there is a guarantee with that...or a crash coming, however every time we have seen these levels a sell off came close after.

Just a heads up :-)

WHAT IF YOU KNEW WHICH WAY THE MARKET WAS ABOUT TO MOVE BEFORE IT HAPPENED?  CLICK HERE To Join Our VIP ELITE GROUP  -- 30 Day Trial Offer Today!     


Thursday, 13 September 2012

Qe3 Announcement & market charts

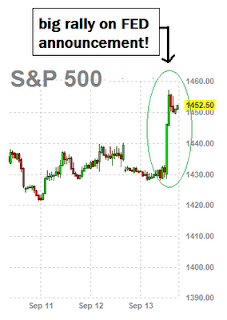
The qe3 announcement came out today. The Federal Reserve managed to surprise a well-primed Wall Street with aggressive commitments with his qe3 announcement to ease until the economy shows signs of healing.


As expected, the Fed announced a new version of quantitative easing and extended its low-rate policy to mid-2015, but it also took the unusual steps of promising to continue mortgage and other asset purchases if it does not see significant improvement in the labor market.

They want us to think qe3 WILL WORK, when qe1 and qe2 did not!!!!!  That is quite comical I must say. But my opinion does not really matter right here and now....
qe3 announcement
qe3 announcement

As you can see the market skyrocketed on the qe3 announcement when it hit the news wires. A VERY huge buy program hit the markets and up we went. We also took out the MAY 2008 highs I have been talking about in the blog here for the last few days.


qe3 announcement 

Now the market....


1) Yesterday I did warn that the market was in a bullish flag pattern, and that is exactly what played out. That would have given you a heads up that the FED news was going to be positive today, and it would have given you a BIG HEADS UP

2) We have broken 2008 highs and 2012 highs also. That is quite significant. 

3) The most important part of today, is that we have been in a bullish channel since JUNE 2012. Today we are back up on that channel resistance as you can see on the charts. 

It has been a very big week, and we seem to be at a very significant spot on the market.

I have talked with my VIP MEMBERS HERE who get all my juicy stuff, and I told them as long as the fed keep printing money it's gunna be hard to 'sell' this beast for now. That is all I can say. :-)


WHAT IF YOU KNEW WHICH WAY THE MARKET WAS ABOUT TO MOVE BEFORE IT HAPPENED?  CLICK HERE To Join Our VIP ELITE GROUP  -- 30 Day Trial Offer Today!    

Wednesday, 12 September 2012

eu bailout fund - approved

eu bailout fund has been approved overnight and the market shot up a bit higher! I do not have to tell you what a joke this eu bailout fund really is right ?

eu bailout fund approved....yes! But the bigger news comes with the FED announcement on THURSDAY! Many traders and analysts have been waiting, and the expectation is that they will announce QE3 or some sort of quantitative easing.

Well... your guess is as good as mine as to what happens. I could go on all night about the fed, and their evil schemes in regards to what is happening in the economy. If you think things are getting better out there in the economy, I mean in the real world you need to go to your doctor for a check up.

Anyway, with the eu bailout fund out of the way, on to the charts for THURSDAY!.


As you can see, the market has been flattish for the last few days. It almost seems to be creating a bullish flag. But overall we are still in the upwards channel.

What I do what to say here is that the markets and sentiment are still firm, however the last few days we have seen selling on the close, and some of it has been fairly big. 

Firm action, but it is interesting that we HAVE NOT taken out the old 2008 highs, the market really is having a hard time trying to do that lately.

We have the Fed decision tomorrow at 11:30am and also jobless claims, so it might be a day to wear your helmet with the chin strap! :-)

I'll be back tomorrow and we shall see how the market reacts to the big FED NEWS!

Happy trading. :-)

WHAT IF YOU KNEW WHICH WAY THE MARKET WAS ABOUT TO MOVE BEFORE IT HAPPENED?  CLICK HERE To Join Our VIP ELITE GROUP  -- 30 Day Trial Offer Today!    

Tuesday, 11 September 2012

FOMC Meeting Coming


Well it was a small range day today. The reason is that many traders and analysts are waiting for the FOMC meeting, which is a two day event and day 1 starts on WEDNESDAY. It is good not to pre-empt the market here, even though we are still in this bullish channel (see chart below). The reason is because sometimes with these FOMC meetings we can be in for a couple of slow days on the market.

The results of the FOMC meeting come out at about 11 am, and then there is a press conference that normally follows straight after. We will see what these criminals decide to do in regards to the economy then.


Happy trading :-)

WHAT IF YOU KNEW WHICH WAY THE MARKET WAS ABOUT TO MOVE BEFORE IT HAPPENED?  CLICK HERE To Join Our VIP ELITE GROUP  -- 30 Day Trial Offer Today!    

September 11th Tribute

September 11th Tribute post today. We will never forget...


Even though I am 32, I remember being back in college 11 years ago, when the September 11th attacks occurred. I was studying for my exams, and my Dad called me over to watch the TV because something big was unfolding. I was in shock, and amazement at the same time. My body literally trembled in disbelief and fear sitting in my chair with my hand over my mouth.  It was something that I have never forgotten.  

I talked to my Father today, and we reminisced back to that frightful day in September 2001, when we both saw this horrible event unfold live on TV. We pretty much saw the whole thing play out on TV, like some horror movie that would keep on repeating over and over again. I could not believe what I was seeing, and how the world was about to change so dramatically in literally 24 hours. WOW!

Not only was this a horrible day, but a tragic event that has totally changed humanity and the way we think. You might be a Generation X baby like myself but I am sure you agree that this is one of the most historical events we have witnessed in our life.

Anyway, as you go about your day today, please stop, and take just 1 moment of your time, and remember those who served, those who lost their life and those who were brave, and helped when others needed them. That is what humanity is all about. Also remember those families who have been affected and who's lives have changed and say a quick prayer that nothing like this will ever happen again!

Lest We Forget!


WHAT IF YOU KNEW WHICH WAY THE MARKET WAS ABOUT TO MOVE BEFORE IT HAPPENED?  CLICK HERE To Join Our VIP ELITE GROUP  -- 30 Day Trial Offer Today!   


Monday, 10 September 2012

t bond chart - what a mess

The t bond chart is a mess at the moment. I have not seen it this messy in a long time. If you are t bond trader at the moment, my guess is you are probably reading this in your straight jacket... ha ha LOL!

Since the middle of August 2012, the t bond chart has done some wild and crazy things.

Have a look at the t bond chart chart below....


As you can see, the murderous slow wet weak market we had last month in August has really thrown things off a bit in t bonds.  Is it up? Is it down? It's just jumping all around! Probably better to concentrate on something else until the chart cleans itself up a bit.

The S&P just closed down -8.84 points today and the bonds did not really move much at all. But atleast we saw some real movement on the market, and I expect more volume to come into the market for the next few months, thank the good lord. :-)

I think with all this talk about QE3, alot of traders are getting thrown off right now. Do not give into that, and just use your charts to trade. Sentiment trader believes that charts never lie, and all the news comes out in the charts first anyway. I have seen this happen 90% of the time anyway, so forget all the fluff and fillers out and there right now.

Alot of traders are waiting for the FOMC meeting mid week, and there is a lot of indecision out there.

As I type this, the S&P is closed down for Monday and we closed at the lows. That Is not bullish in the VERY SHORT TERM. We shall see what happens Tuesday.

Happy Trading :-)

WHAT IF YOU KNEW WHICH WAY THE MARKET WAS ABOUT TO MOVE BEFORE IT HAPPENED?  CLICK HERE To Join Our VIP ELITE GROUP  -- 30 Day Trial Offer Today!   

Sunday, 9 September 2012

When will silver explode

When will silver explode I hear many investors asking? Well, that is a VERY good question.

In fact I am just have a chuckle to myself right now looking at my screen and asking "When Will Silver Explode"....WHY?

Well instead of TRY to explain it to you in layman's terms, how about I post a chart....


It seems that silver is already exploding as you can see on the chart above, silver was trading in an ascending triangle pattern for months before it decided to breakout. Since then, we have skyrocketed up to nearly $34 today. A pretty impressive move I must say! I did post further thoughts on this in our VIP MEMBERS SECTION HERE! 

Technically its a great move especially if you trade silver futures or own the physical stuff like me. But there are more things going on (technically and fundamentally) that you probably do not know about. 

Now I will be the first one to admit silver has probably over extended itself in the short term on the charts, and we have not seen a move like this in quite a while in commods. But take this as a warning sign to watch silver in the coming months. 

Will silver explode higher, or when will silver explode higher, I do not know, but I am really taking a liking to the silver chart right now. 

WHAT IF YOU KNEW WHICH WAY THE MARKET WAS ABOUT TO MOVE BEFORE IT HAPPENED?  CLICK HERE To Join Our VIP ELITE GROUP  -- 30 Day Trial Offer Today!   
Reasons for stock market volatility

There are lots of reason for stock market volatility right now. It has caught alot of traders unaware, Here are the top 3 top reasons for stock market volatility in late in 2012 :-

1) The 2012 U.S. Election campaigns are upon us. Traders are not thinking rationally, and are caught up in the hype and hysteria going into the November elections. Some traders are even investing patriotically, meaning they are just buying up everything blind folded without looking at a chart. This can create sudden movements out of nowhere, and even movements after hours that do not normally occur.

2) August is notoriously known to be a quiet low volume month, and professional traders worth their salt are away in the Hamptons on holidays. September is known to be one of the most volatile months on record as the big boys return to their desk and start to trade the market again. Increasing volume and larger shifts of money creates "free flowing" movement on the market and thus increasing volatility significantly.

3) The last 3-4 months of the year program algorithm trades tend to be large and more domineering. That means that if large sell stops or buy stop orders sitting in the market are triggered it tends to set of a domino type situation where quick market upswing or downdrafts can occur.

All these are contributing factors and reasons for stock market volatility as of late. So sentiment trader is here to say expect more of the same going into the end of 2012.


If we have a look at the market leader or the DOW JONES TRANSPORTS Chart (or the leader of the market) we can see in the last few weeks just how volatile the market has been, and how it has tricked traders.


As you can see there have been breakouts, and fakeouts, that got the bears excited, but the Transports remains in a range for now. The plan with our VIP MEMBERS still remains the same.

WHAT IF YOU KNEW WHICH WAY THE MARKET WAS ABOUT TO MOVE BEFORE IT HAPPENED?  CLICK HERE To Join Our VIP ELITE GROUP  -- 30 Day Trial Offer Today!  


Friday, 7 September 2012

Quantitative Easing History - Shocking Secrets

Quantitative Easing History - Shocking Secrets
RANT WARNING! : For those that refuse to listen or have an open mind to the truth, this post is most definatly not for you! ;)


There is a lesson you need to know in Quantitative Easing History. Right now all we are hearing on the news and radio is how the NOVEMBER elections are coming up, and which man is the right man for the job. Romney, some rich guy, who only wants to get famous, or the black guy from down south, OBAMA who is the currently running the show, but going down as one of the worst presidents on record. 

Let's face the facts, here we have two boys in the school yard showing off, and trying to tell the other, MINE IS BIGGER THAN YOURS....With everyone else around them cheering. Pathetic really!, and at the same time, we are experiencing one of the worst financial crisis's on record. Just think about how much money is being pumped into these campaigns to help both these morons. Probably billions of dollars, yet at the same time, there are people on the street with no job struggling. Poverty is at an all time high and how much of this money are those in need getting. ZERO ....ZILCH.... NUDDA!

It makes you think about how the world really works, and that is what we are talking about here. This money is being spent and it is money that was not really there in the first place. Funny how that works...Right? And now there are hints of QE 3 (or quantative easing 3) and again they seem to be getting all this money out of thin air. 

Most people have not caught on yet, that the world in which they live is different to what you see on the outside. Beneath the surface there are evil banksters who have organised this financial crisis for a reason. To get more power and control. The next guy who becomes president (I am guessing it is more likely to be OBAMA in November) is just a puppet on the string for the elite. They already know who they want to take office and the most manipulative so that they can get their job done for them, whether you like it or not.

The sleasy white collar criminals lay beneath the surface, and love the fact that 90% of the people out there are asleep to what is really going on. Their plan years ago is succeeding. 

1) CREATE A TYPICAL SOLUTION TO THE PROBLEM  (Quantitative easing, buying up debt)

THEN....

2) CAUSE THE PROBLEM (simply to create derivatives, CDO's, Subprime, Leveraged Vehicles etc)

To the naked eye, most thought it was the opportunity of the century, and got involved. But just look what has happened since! The elite were always two steps ahead of everyone out there, and used their minions to implement and bring their plans into existence. All the while people with either limited funds or lots of money got netted into the scam. Are you starting to see what is actually happening now?

Now what we have is one of the biggest financial implosions on record, and the money for the middle class and poor is yet again being siphoned off to the elite and those rich bankster gangsters, just like they planned. The rich get richer and the poor get poorer!, it is not just a saying, it has real truth. 

Quantatative Sleasing 3 (or QE3) as I call it, was planned even before QE1 was even implemented. They have an agenda and are sticking to their plans here at the end of 2012. What happens next, I am telling you is going to be bad, VERY BAD, because that is where they need things to implement more of their evil plans.

They are going to run things into the ground, so they can again buy them up cheap. That is what they are going to do whether you like it or not. This is already happening. It has already been planned and they have their weasly ways on how they are going to implement it slowly so the average person only wakes up when it is too late. When I say they will "run things into the ground", you are only just starting to see the beginning stages to all of this. When things are in full swing, you will remember reading this post and probably not like the things happening around you day to day or even in your home town. But don't shoot the messenger, I am just here to warn you.

Time to wake up and prepare was yesterday. Cause the coming storm is an F5 and most people will not be ready for it. Go figure huh?

WHAT IF YOU KNEW WHICH WAY THE MARKET WAS ABOUT TO MOVE BEFORE IT HAPPENED?  CLICK HERE To Join Our VIP ELITE GROUP  -- 30 Day Trial Offer Today!  

Bulls 2 Day March! - Ole


TGIF (Thank God It's Friday), Well it has been a long week, the jobs report came out today a little bit on the weak side, but again as sentiment keeps saying that really has not affected the S&P to the downside. We had a Very typical small range that normally occurs after a big up day. Even though it was a smaller range day today it seems that the bulls still have control of this market for now.


What we do want to note is that the market right now is up against its 1440 highs a level we saw back in MAY 2008, and that is a very important level there. Again, we must be cautious, but sentiment trader is warning there is a bit of a small melt up type situation that seems to be playing out.

The market still remains strong and within the upwards channel we have noted several days ago.

There is not much economic news coming in the next few sessions, however there is the FOMC next week, that alot of traders will be watching.

Happy Trading :-)

WHAT IF YOU KNEW WHICH WAY THE MARKET WAS ABOUT TO MOVE BEFORE IT HAPPENED?  CLICK HERE To Join Our VIP ELITE GROUP  -- 30 Day Trial Offer Today! 

Upwards Channel

A few days ago sentiment trader suspected that bears were coming back into bonds, and the market was about to see some more green. And here we are on the S&P 500. See how we are still in the upwards channel with a little bit more room to move north.

After an annoying August and sideways grind we have finally broken to the upside and likely to see a bit more upside action. It will be interesting to see where the bulls want to take us from here. But as you can see on the chart below there are some short term targets on the card.


There are some important announcements / news coming on Friday, however we always come back to our favorite statement that the "news always comes out in the charts first!" and nothing can be more further than the truth!. So we shall see what the market will bring to us with one day trading left for the week. 

Happy Trading :-)  

WHAT IF YOU KNEW WHICH WAY THE MARKET WAS ABOUT TO MOVE BEFORE IT HAPPENED?  CLICK HERE To Join Our VIP ELITE GROUP  -- 30 Day Trial Offer Today! 


Wednesday, 5 September 2012

Bullish on bonds

Bullish on bonds ? I actually went through many charts including bonds today and even visited some well known blogs! What I can tell you is that many people and analysts are bearish on the stock markets right now! Sentiment trader takes this as a warning sign that as a trader you might not want to get super bearish right now! That is the smart thing to do.

Infact looking at the bonds chart, it looks to be a bit more on the bearish side of things so sentiment trader is telling to look out for a bit more upside coming on the S&P 500 and US indicies.

WHAT IF YOU KNEW WHICH WAY THE MARKET WAS ABOUT TO MOVE BEFORE IT HAPPENED?  CLICK HERE To Join Our VIP ELITE GROUP  -- 30 Day Trial Offer Today! 

Sunday, 2 September 2012

Interesting Inflection Point Here?

The sentiment trader is watching one of our favorite market breadth indicators - The SPXA50R where it has been in a very strong buy stance, that seems to be shifting a bit at the moment. The market right now seems to be now coming into some head wind resistance.


As you can see on the chart above the market is heading into overbought conditions. There could be some upside momentum left, however from viewing this chart there is a low possibility of that actually playing out.

Since the JUNE lows on the S&P 500 ( 1260 'ish ) we have seen an extensive rally. Now we are in SEPTEMBER and both September and October are notoriously known amongst traders as a time the market can see trouble brewing. We remain on the backfoot and watch as the sand could be shifting here, but there is no need to panic just yet. :-) In August the market was very sloppy, however I doubt sloppy will be the best way to describe the market now in SEPTEMBER / OCTOBER!!!!

Due to the US long weekend, I am taking a bit of break from trading today, but I will post up some other charts of interest later in the week.

Good luck and happy trading.

CHIP :-)

WHAT IF YOU KNEW WHICH WAY THE MARKET WAS ABOUT TO MOVE BEFORE IT HAPPENED?  CLICK HERE To Join Our VIP ELITE GROUP  -- 30 Day Trial Offer Today! 

Sentiment Trader Is Born

Hi Guys,

Chip here! I have been asked by my friends and colleges to start a blog. The reason was to share my tidings and good will amongst other traders. However I have soon come to realise, that many of my friends, family and colleagues are amazed with some of my market calls, as I am a full time trader, and this is how I make my living. I am really a no one and do not like to big note myself, but I do have a passion to help people make make money on the global stock markets.

I trade the S&P 500 futures, and other vehicles, and have done so for many years. I call this blog THE SENTIMENT TRADER because I do not normally go against the herd, I make my money by following what the smart money is doing and what I feel is the general consensus of the market is doing. That is what has made my trading so effective over the years. If I feel they are buying, I like to buy, and if they are selling, then I too will become a seller. My trading is simple, but yet effective and I believe we are about to see some significant moves on the market and decided to start this blog and share my thoughts, feeling and some of my trading positions for those interested.

I believe there are a lot of bad advice and lots of people out there losing money and it is my main goal to help those struggling and to give them the best analysis and direction on the market I can give, to help them succeed. Young, old, or in between I love to help others make money and become successful just as I have done. I have been doing this for many years and I hope to see you become a regular reader of my little blog here. Hopefully after years of searching for that perfect little gem you have found your home.

Good luck, and happy trading to you all.

Chip! :-)