Since the middle of August 2012, the t bond chart has done some wild and crazy things.
Have a look at the t bond chart chart below....
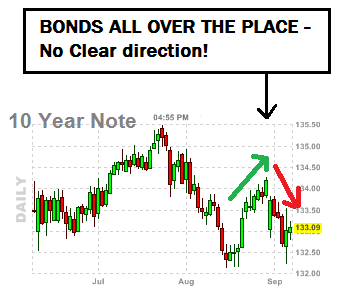
As you can see, the murderous slow wet weak market we had last month in August has really thrown things off a bit in t bonds. Is it up? Is it down? It's just jumping all around! Probably better to concentrate on something else until the chart cleans itself up a bit.
The S&P just closed down -8.84 points today and the bonds did not really move much at all. But atleast we saw some real movement on the market, and I expect more volume to come into the market for the next few months, thank the good lord. :-)
I think with all this talk about QE3, alot of traders are getting thrown off right now. Do not give into that, and just use your charts to trade. Sentiment trader believes that charts never lie, and all the news comes out in the charts first anyway. I have seen this happen 90% of the time anyway, so forget all the fluff and fillers out and there right now.
Alot of traders are waiting for the FOMC meeting mid week, and there is a lot of indecision out there.
As I type this, the S&P is closed down for Monday and we closed at the lows. That Is not bullish in the VERY SHORT TERM. We shall see what happens Tuesday.
Happy Trading :-)
WHAT IF YOU KNEW WHICH WAY THE MARKET WAS ABOUT TO MOVE BEFORE IT HAPPENED? CLICK HERE To Join Our VIP ELITE GROUP -- 30 Day Trial Offer Today!
No comments:
Post a Comment