Web Statistics The Sentiment Trader
Showing posts with label dow jones. Show all posts

Sunday, 29 April 2018

A shift to safety trades could burn investors - A shift to safety trades could burn investors


A shift to safety trades could burn investors

"A shift to safety trades could burn investors" 

in the newsA shift to safety trades could burn investors? What this all about..... See below. 

------------------------------

Sentiment Trader saw PNC Financial's Jeffrey Mills has a message for investors: Resist the urge to play it safe.

The firm's top investment strategist is concerned jitters are driving investors into less profitable or worse — losing — areas of the market.

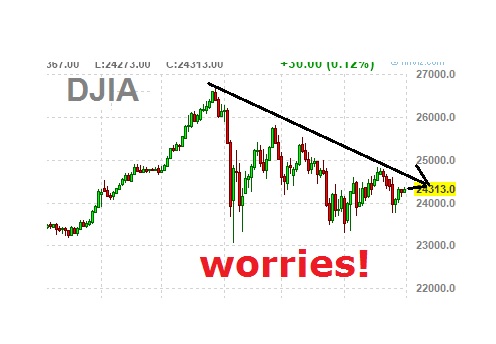
Right now the market is not looking the best, and its not only that, you can see the lower highs being put in, is really a troubling sign here, and its not the little guys on the backfoot, it has some bigger FUNDS shaking in their boots, look at the dow JONES charts, its defiantly skating on thin ice here. 

Folks may have an inclination to do drastic things in portfolios to insulate themselves from higher volatility when in fact we think the backdrop would actually portend the exact opposite.

"It's key to understand that the call for higher volatility doesn't have to be a call for poor market performance," 

His hunch appeared to be timely. According to the Investment Company Institute, investors yanked the most money out of U.S. stocks in February since the 2008 financial crisis. The data suggest market participants are getting increasingly nervous amid whipsaw action in stocks.

"Investors, and really humans in general, have this inclination to try to make themselves feel safer,"  think about folks who are afraid to fly. They actually choose to drive even though driving is exponentially more dangerous."

The Dow Jones Industrial Average and S&P 500 Index are now are essentially flat for the year. Meanwhile, the Nasdaq is up 3 percent year-to-date.

Economic fundamentals and solid earnings will push stocks higher this year even though valuations remain elevated — adding it's the wrong time to get majorly defensive. The Dow may not soar 25 percent like in 2017, but he predicts the S&P 500 will likely grow between 4 and 6 percent over the next 12 months.

Right now, there are some smart money shifting into financials, energy and technology stocks. We are not sure if this is key, but we do like to watch what the smart money is doing, and where they are going. 

We don't think valuations are as extended as maybe some people would think given the run, If you look at the percentage of companies in the tech sector above their 200-day moving average, it's actually some of the best breadth we see across sectors.

fixed income and cash, as sectors that could burn investors with poor returns in the coming months, when compared to stocks. Either way, things are getting nervous in the market, and we will share our SECRETS and findings HERE with our VIP members each day. You can get your FREE 30 Day trial here. 

DON'T MISS OUT ON OUR HOTTEST updates Click the link below....

Thursday, 9 February 2017

Stock Market Rocketing - Stock Market Rocketing but why


Stock Market Rocketing

"Stock Market Rocketing" 

in the news Stock Market Rocketing? What this all about..... See below. 

------------------------------

Sentiment Trader  has been watching the stock market. We have some very cool ideas for investments under trump. But first thing first.....Stocks just keep tiptoeing into record highs....

While Stock Market Rocketing Here are some stats you might want to look at because at the end of the day, we do not know what the stock market will do next, but we can work off pre-existing data to see what COULD happen in the future! Here are sentiment trader we love to do that sort of thing. 

STATS : Despite the flurry of record highs on Thursday, the big three major U.S. averages haven't seen a 1 percent move — either up or down — in more than two months.

Neither Nasdaq composite, nor S&P 500, nor the Dow Jones industrial average has seen a 1 percent move in either direction since Dec. 7. If there are no 1 percent moves in Thursday's session, it will mark the 43rd straight session without a 1 percent move for all three indexes.

That would be the longest such streak for the Nasdaq since the 73-session streak that happened between June and October in 1989.

The S&P 500's current streak would match that of late summer in 2016. If the S&P 500 doesn't have a 1 percent move Thursday or Friday, it will mark its longest streak since the 62-session pattern from April through July in 2014.  This is quite interesting. 

Meanwhile, the Dow is having its longest such streak since the 52-session run in the summer of 2014.

Since the current streaks started in December, the Dow and S&P 500 are up 3 percent, while the Nasdaq is up 6 percent. Here is a chart of the nasdaq, but is it a FAKEOUT or BREAKOUT!


Stock Market Rocketing


DON'T MISS OUT ON OUR HOTTEST updates Click the link below....

Friday, 14 August 2015

stock market update - sentiment trader stock market update

stock market update - sentiment trader stock market update

stock market update


U.S. stocks closed higher on Friday amid news regarding Greece and after the release of three more economic data sets while investors' focus shifted back to the Federal Reserve.

We think the big announcement is the FED meeting in SEPTEMBER where Yellen and her slew of morons, will try to work out if they actually do RAISE rates. Until then, all we get is rumors, rumors, rumors. So do not fall into that trap.

U.S. equities hit session highs less than an hour ahead of the close as news about the euro zone confirmed it agreed to launch a new bailout program for Greece. Before then, the three major indexes traded in a range similar to that of Thursday.

Stocks closed near the flatline on Thursday after giving back the bulk of their gains less than an hour ahead of the close, despite worries about China largely dissipating as investors digested a slew of economic data.

Big picture, We think we're still contending with some of the ripple effects of of what's going on in China, and The GREEK news is back on the table. They are in all sorts of problems over there.

China devalued its currency this week, the yuan, by over 3 percent against the greenback, taking global markets by surprise.

The major indexes managed to eke out gains for the week despite the volatility brought about by the yuan's depreciation. The Dow Jones industrial average gained 0.6 percent, while the S&P 500 rose 0.68 percent. The Nasdaq rose just 0.9 percent as biotechnology stocks fell 1.25 percent for the week.

Right now you can see the SPX has been forming what we call in technical analysis a SYMMETRICAL TRIANGLE. 

Basically triangles form because the buyers and sellers are tussling and no one is winning or taking control right now. Eventually one side will win, and you get the BREAKOUT OR BREAKDOWN. So far its a bit too early to tell, as we are still inside the triangle pattern itself. So its anyone's game right now. 

 With the FRIDAY close Today closing near the upper falling resistance line. This makes it very interesting for next week. As sooner or later these triangles break, and it seems its trying to break to the upside, but alas, we  are going to have to wait till next week no doubt, as there is a slew of data and news coming out then. But its an interesting pattern setting up. See the chart below.....

I cover more and more technical analysis ==> HERE in our VIP members section.


WHAT IF YOU KNEW WHICH WAY THE MARKET WAS ABOUT TO MOVE BEFORE IT HAPPENED?  CLICK HERE To Join Our VIP ELITE GROUP  -- FREE!


Powered by 123ContactForm | Report abuse

Wednesday, 12 August 2015

stock market update - sentiment trader stock market update

stock market update

As you can see the three main markets stacked up on top of each other to make it easier to view.

There is so much drama right now, and the markets around the globe are getting hit! The GREEK news is resurfacing, the Chinese market has been crashing, and the govt in China are doing everything in their power to try and stop the "bloodletting!" even revaluing their currency to try and make things right. But even that is not helping, OBVIOUSLY!!

I will state the obvious about this chart you can see below.

1) DOW JONES, is fairly supressed, it is well under the 50 day moving average. It is still looking kind of weak. 

2) The LEADER of the market or the dow jones transports chart is sitting right on the 50 day moving avererage. Normally this is a good sign, but we will want it to go up and break through this line convincingly. So far that is not the case, but we must watch this over the coming days. 

3) The UTILITIES sector is heading up fast to new highs. Its one of the sectors outperforming lately with the GREEK CRISIS, and the CHINESE stock market drama. This is a sector to keep your eyes on in the coming week, that is for certain. 

I cover more and more technical analysis ==> HERE in our VIP members section.

stock market update
stock market update


WHAT IF YOU KNEW WHICH WAY THE MARKET WAS ABOUT TO MOVE BEFORE IT HAPPENED?  CLICK HERE To Join Our VIP ELITE GROUP  -- FREE!


Powered by 123ContactForm | Report abuse

Saturday, 28 September 2013

Debt Ceiling Crisis - The devil debt ceiling Crisis

Debt Ceiling Crisis - The devil debt ceiling Crisis

You have to hand it to the US government. They are certainly innovators when it comes to the US economy. LOL. Just as you think they have run out of crisis' up pops the debt ceiling again whcih could see the Obama administration run out of money again by OCT 17th next month.

To be precise no president in the history of the US has been in this position where they can no longer borrow, and he is in uncharted territory here.

Investors are certainly feeling the pinch recently, as the DOW JONES hit a nice resistance point and has sold off all this week.


  WHAT IF YOU KNEW WHICH WAY THE MARKET WAS ABOUT TO MOVE BEFORE IT HAPPENED?  CLICK HERE To Join Our VIP ELITE GROUP  -- FREE!


Powered by 123ContactForm | Report abuse

Monday, 23 September 2013

Dow Jones Daily Chart

Dow Jones Daily Chart


dow jones daily chart


The Dow Jones Daily Chart is showing that we have had 3 down days in a row. Something that has not happened for a while. You can see that we are getting close to a 50 Moving Average too, which is watched by alot of analysts. The MACD signal is still not on a SELL signal.

Still I think we are holding pretty well after the major run we have had up over the last few weeks, and sentiment trader things we are still in a bull market. The debt ceiling talks are really messing with the markets here, and more lies from capitol hill will not give the market too much direction in the short term. Tapering and also debt ceiling is the talk of the town right now going into the end of the year!

  WHAT IF YOU KNEW WHICH WAY THE MARKET WAS ABOUT TO MOVE BEFORE IT HAPPENED?  CLICK HERE To Join Our VIP ELITE GROUP  -- FREE!


Powered by 123ContactForm | Report abuse

Thursday, 8 August 2013

Head and shoulders pattern

Head and shoulders pattern on dow ?

Stocks snapped a three-day losing streak Thursday, with the S&P 500 finishing just below the 1,700 mark, buoyed by stronger-than-expected Chinese trade data and following a favorable jobless claims report.

Right now there are alot of analysts saying this market is strong... however if we look at the DOW JONES chart, I would not be calling this chart strong at all.

First of all we have been travelling sideways for weeks now.

Second, we are in summer trading and volume is very light making the action quite volative.

Lastly, as a whole the last few weeks could be nothing more than a nice HEAD AND SHOULDERS pattern, which would be a warning for people NOT to be too bullish for now.


dow jones daily chart


WHAT IF YOU KNEW WHICH WAY THE MARKET WAS ABOUT TO MOVE BEFORE IT HAPPENED?  CLICK HERE To Join Our VIP ELITE GROUP  -- FREE!


Powered by 123ContactForm | Report abuse

Monday, 22 April 2013

dow jones prediction - barrons scary dow jones prediction

dow jones prediction - barrons scary dow jones prediction


dow jones prediction


So did anyone see the latest dow jones prediction on the cover of barrons magazine lately?

I must say it was very very interesting! (see above)

I could write a complete 20,000 word essay on how I think the mass media, government, banks and other entities have been manipulating this market, but lets focus on this brilliant piece of artwork that circulating its way around the large groups of investors at the moment.

Barrons has just aired their latest dow jones prediction for all to see, and they are calling for dow jones to hit 16,000 on the index very soon. I thought it was amusing they had a bull on a pogo stick jumping over a bewildered bear! HAHA, I did giggle like a school girl when I saw that drawing, I mean it was pretty clever! I love how the mass media and pundits are becoming like the holy bible and spreading the good news like  one of Jesus disciples in the old testament.

I do not subscribe to barrons, but I find it interesting that they do become extremely bullish and bearish at the wrong times! Also they never seem to mention the TRUTH that there is a very bad financial crisis looming soon, it will not come tomorrow, or next month, but somewhere down the track we will become witness to what I believe to be a repeat of 2008, perhaps something much worse. I would probably  label it something along the lines of a FINANCIAL CRISIS 2.0

I do not see these sorts of headlines on the magazine, just market predictions and propaganda for the average trader out there to read.

When I showed this picture above and the dow jones prediction of 16,000 to a fellow trader this morning, he did laugh and then reminded me, that the last two times BARRON'S become super bullish on the market it sold off very hard and was significantly lower several weeks later. It is almost identical to their last DOW JONES PREDICTION call on the market.

Will they jinx the market again? Only time will tell. :-) *insert cheeky smile here* :-P


WHAT IF YOU KNEW WHICH WAY THE MARKET WAS ABOUT TO MOVE BEFORE IT HAPPENED?  CLICK HERE To Join Our VIP ELITE GROUP  -- FREE 10 Day Trial Offer Today!


Powered by 123ContactForm | Report abuse


For all other enquiries ==>  CLICK HERE TO CONTACT US


Friday, 19 April 2013

Is This Time Different - Is This A Dip Or A Sell Off


Is This Time Different? Is This A Dip Or A Sell Off

Dow down 52 points, but S&P 500 up 5 points — huh? IBM is down over $14, responsible for roughly 100 Dow points.

So what is happening? just yesterday we put out a MAJOR UPDATE to our  VIP SUBSCRIBERS - Download it here!     We told them what we thought is happening on the market. 


spx chart
spx chart


Everyone wants to know, Is this time different? The meager three percent pullback in the S&P 500 at the end of February made a lot of traders believe that any pullback should be bought, but there has been a lot of discussion this week that this pullback might be different. The following arguments are being batted around:

1) the technicals are worse: this week has seen two days (Monday and Wednesday) where 90 percent of the volume was on the downside on very large volume; this has led many to question whether we are still in an up trend in the markets;

2) the macros are different: March and early April economic numbers (Philly Fed) have been weak (this is becoming a regular Spring event);

3) tech is in trouble; Fairchild Semi and Sandisk had notable drops yesterday, IBM is down four percent this morning on its earning miss, and Apple is at a new low 52-week low.

However, it's a little early to draw any conclusions from earnings, other than tech disappointment. Early bank reports (JPMorgan and Wells Fargo) were good, but Bank of America disappointed, and multi-industry company reports have been mixed. General Electric was fair but CEO Jeff Immelt noted ongoing weakness in Europe.

As of this morning,104 companies have reported (21 percent of the S&P 500), with 67 percent beating expectations — slightly above the norm. Earnings are 2.0 percent higher than the same period last year, with revenue outpacing last year by 3.2 percent, according to S&P Capital IQ. However, guidance has been cautious to

WHAT IF YOU KNEW WHICH WAY THE MARKET WAS ABOUT TO MOVE BEFORE IT HAPPENED?  CLICK HERE To Join Our VIP ELITE GROUP  -- FREE 10 Day Trial Offer Today!


Powered by 123ContactForm | Report abuse


For all other enquiries ==>  CLICK HERE TO CONTACT US


Sunday, 24 March 2013

The Air Up There

After new highs each week on the market, you can see the dow jones, has hit some headwinds, and has not really done much at all in the last few weeks.

The levy news in cypress did not help one bit, and it is obvious from the chart below, traders right now are in a 'wait and see' approach.


Free Newsletter (Worth $97)


.

Tuesday, 5 March 2013

us stock market today - all time stock market high

us stock market today - all time stock market high

The us stock market today hit an all time stock market high and news and media were going nuts!

I guess right now would be a good time to tell our reading NOT TO FALL IN LOVE WITH THE DOWNSIDE YET. Plenty more upside could be on the way soon! Time will tell. 

Have a look at the dow jones stock market today below, it hit an all time stock market high and got investors very excited. But what does this really mean?

us stock market today - all time stock market high


Even though the us stock market today hit all time stock market high today, it seems to be "steady as she goes" for the economy, but as you can see above even though the us stock market today hit all time stock market high today, its causing many people to party hard, but should they really be doing this?

The Dow Jones industrials hit all time stock market highs today, record highs not seen since before the 2008 financial crisis and it seems more and more investors are willing to take a punt on the stock market!

So is now the time to venture back into the water or are traders turning a blind eye to what is happening out there in the real world and the the current global economic problems we are facing in next 24 months.

Ben Bernanke was recently quoted as saying they will not CHANGE or MODIFY the current quantitative easing anytime soon, and should not expect maximum liquidity conditions to change as well and that is adding to the optimism of most analysts.

As you can see this pumping of money is keeping the markets afloat. With the us market today and all time stock market high 's seen, it is solidifying the chart below telling us we are still in a BULL MARKET, which started back in January 2012.

bull bear market
bull market showing


But on the downside, remember even in bull markets nothing goes up in a straight line, and that is a key point to remember. Also on the downside one must remember that there is a good chance of a correction soon, as many companies right now are way above their intrinsic values.


WHAT IF YOU KNEW WHICH WAY THE MARKET WAS ABOUT TO MOVE BEFORE IT HAPPENED?  CLICK HERE To Join Our VIP ELITE GROUP  -- FREE 10 Day Trial Offer Today! 


Wednesday, 27 February 2013

Dow jones repeating pattern - Dow jones repeating pattern

Dow jones repeating pattern

Is there a Dow jones repeating pattern on the chart.

When I took a look at the Dow jones transports chart, I thought to myself, we could be looking at a repeating pattern or a replicating pattern.

Repeating patterns on the market are very frequent and we do teach our VIP members this from time to time. Anyway, the dow jones transports chart took my fancy today, and thought I would post it for all eyes to see.

Dow Jones Transports chart

WHAT IF YOU KNEW WHICH WAY THE MARKET WAS ABOUT TO MOVE BEFORE IT HAPPENED?  CLICK HERE To Join Our VIP ELITE GROUP  -- FREE 10 Day Trial Offer Today! 

Wednesday, 9 January 2013

bullish flag - bullish flag on dow jones

bullish flag - bullish flag on dow jones

If I was a gambling man, I would say we are about to see a pop higher on the DOW JONES. The coiling we have been seeing the last few days could have turned into a bullish flag.

That means we could be expecting a breakout of the flag pattern seen below and higher prices are coming in the next day or so, at least.

It seems the BULLS have certainly not lost hope yet.


bullish flag
bullish flag on dow jones chart


WHAT IF YOU KNEW WHICH WAY THE MARKET WAS ABOUT TO MOVE BEFORE IT HAPPENED?  CLICK HERE To Join Our VIP ELITE GROUP  -- FREE 10 Day Trial Offer Today! 

Friday, 4 January 2013

risk on risk off - is it risk on or risk off


weeeeeeee! Up We Gooooooo!!!! LOL :P


The S&P is up over 70 points in 3 days. WOW! IT has been a complete BEAR SMOKING to the upside here.

We warned our readers to not fall in love with the downside, when we were in low volume holiday trading and now you can see why :-)

Today was a good day in the market. MOC we had almost 7 billion volume to buy. Even though the markets are overextended, they can remain that way for a while. Bears have really been creamed in the last few days, and probably lost all hope. LOL :->

What is happening right now, is that we get all these little FALSE sell offs, and that has been tricking the bears. They have been trying to test the market on the sell side, they put in their buys stops, we rally up higher, then their stops go off like a rocket and that gives us more of a boost higher!

When you have NATURAL CASH buying or buyers in the market, like we do have right now they send us up higher and keep us triggering the buy programs and or buy stops up overhead. That's what I saw many weeks ago, and warned our readers and that is why we keep ripping to the upside.

Over the last 4 days, smart money has put $5.5 billion dollars to work in the broader markets. In laymen's terms this means in the short term, the markets are most likely to go HIGHER. YES!

I guess we can say that there is a little bit of risk here also at the moment. The higher the market goes up without any serious pullbacks, at some point we will get that pull back and it will probably be a good sized one.

Now we are above our important levels of 1440 and 1450, it means that we are possibly making our way to the 1485 - 1490 now, so prepare yourself. :-)

Already our members are off to a flying start for 2013, and we are only a few days in. :-)

Happy trading :-)


WHAT IF YOU KNEW WHICH WAY THE MARKET WAS ABOUT TO MOVE BEFORE IT HAPPENED?  CLICK HERE To Join Our VIP ELITE GROUP  -- FREE 10 Day Trial Offer Today! 

Thursday, 20 December 2012

Say Hello To Opex

Well we only have one days trade left before OPEX week is over. If you are not aware 73% of the time, OPEX week is usually bullish or the market closes on average GREEN! So there is no surprises if we get a little more up.

But if you have been reading our previous posts, you would not be surprised. We have been fairly bullish since the MIDDLE OF NOVEMBER - SEE HERE!

The market breadth and leading indicators we choose to use, have been saying buy the dips, and that has been spot on!

Have a look at the russell since our middle of november call. LOL. There has been a very nice run up, and only a few red days inbetween. WOW!

As you can see, the russell is in a nice upwards bullish channel. This week has been very good on the russell and other indicies in OPEX and our stance remains the same.


WHAT IF YOU KNEW WHICH WAY THE MARKET WAS ABOUT TO MOVE BEFORE IT HAPPENED?  CLICK HERE To Join Our VIP ELITE GROUP  -- FREE 10 Day Trial Offer Today! 

Tuesday, 25 September 2012

Bears Won Today

Well the bears had a ball today! As was expected the Transports have been leading the charts and warning us that a day like this was in the works for weeks now. So I am not surprised.

Have a look at the hourly chart on the S&P it was pretty much a bearfest day from start to finish!!


With the TRIN over 2, and tick heading to the oversold area, I do think that ( Level For VIP MEMBERS ONLY ) level is coming very soon.  But patience is required.


On the daily chart the S&P is still within the upwards channel, but after today we zoomed back down and stopped right at the bottom of the rising channel. So now we are at a make or break level. The next few days will be interesting!!!!


WHAT IF YOU KNEW WHICH WAY THE MARKET WAS ABOUT TO MOVE BEFORE IT HAPPENED?  CLICK HERE To Join Our VIP ELITE GROUP  -- 30 Day Trial Offer Today!