Web Statistics July 2013

Tuesday, 30 July 2013

gold futures technical analysis

gold futures technical analysis

If we take a look at the latest gold futures price we can see the bulls are back a bit lately. We are trading in a nice clean upwards channel, and we have a pennant inside that channel. 

In the last few weeks, the bulls seem to be back in gold. If we see prices remain in this upwards channel gold will likely continue upwards.

gold futures technical analysis

gold futures technical analysis

.


WHAT IF YOU KNEW WHICH WAY THE MARKET WAS ABOUT TO MOVE BEFORE IT HAPPENED?  CLICK HERE To Join Our VIP ELITE GROUP  -- FREE!


Powered by 123ContactForm | Report abuse

Monday, 29 July 2013

The T Bomb - Taper time

It’s a very busy week for economic data. Investors will get their first look at second-quarter gross domestic product on Wednesday. Economists surveyed by MarketWatch forecast the data to show the economy grew at an annualized rate of just 1% after a mediocre 1.8% expansion in the first three months of the year.

Investors are closely watching the Fed for any further clues as to when it may begin tapering its purchases of government bonds. Concerns over a slower pace of stimulus was tied to a pullback by stocks last month, though equities soon recovered to see the S&P and Dow head back to record territory.

May I take a moment and remind you want happened last month back in JUNE when we had the FOMC meeting.

So..... do you remember what happened???.....

THIS!....


fed announcement sell off


Since then the FED has done nothing, no tapering, no withdrawal of stimulus, no shouting, just more B.S.  We have skidded up higher, and I find it uncanny the market is acting the way it is right before this major announcement. This might be a bear trap in the making as traders are starting to think about what happened last time. It could be a situation of ROPE IN THE BEARS, Before sending us up higher. Sneaeky!, but I can see that happening. It would be a good way to take money off the novice traders out there.

My guess (and it is a guess) is that nothing changes, Somehow the charts do not look like they are about to drop like they did back in JUNE. So my guess is that the news is coming out in charts first here, yes, no taper has started and they will not drop the T Bomb word just yet. It may however come into their vocabulary later down the track, but for now the market is in a holding pattern.  We shall see.

  WHAT IF YOU KNEW WHICH WAY THE MARKET WAS ABOUT TO MOVE BEFORE IT HAPPENED?  CLICK HERE To Join Our VIP ELITE GROUP  -- FREE!


Powered by 123ContactForm | Report abuse

Sunday, 28 July 2013

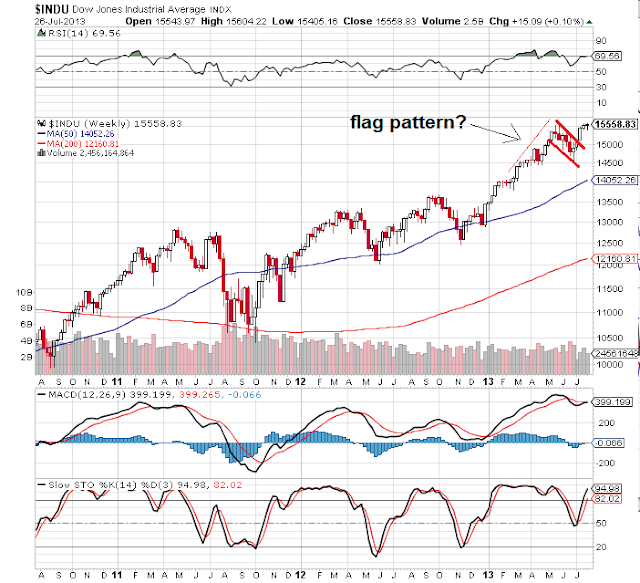
Dow Jones Weekly Chart

Dow Jones Weekly Chart

Top callers and those shorting this market, but be very frustrated right now. The DOW JONES WEEKLY CHART Below is show how strong and resilient this market is. You do not even have to guess when you look at the weekly chart.

The last major dip on the market seems to have just created another bullish flag we have now broken out of. I do agree this market is a little overbought, but I have been getting emails from my readers since the DOW was at 12,000 trying to convince me the market was topping out and a crash was coming. So far we have not seen that at all. It is better to let the charts do the talking for now, and right now they keep telling us a different story.

Eventually we will get to major extremes in the market, but the market can remain in extremes longer then anyone can imagine. Better to trade what you see today, not what you expect to happen tomorrow.


WHAT IF YOU KNEW WHICH WAY THE MARKET WAS ABOUT TO MOVE BEFORE IT HAPPENED?  CLICK HERE To Join Our VIP ELITE GROUP  -- FREE!


Powered by 123ContactForm | Report abuse

NYMO chart

NYMO chart

We are -57% on the NYMO.

The NYMO tends to trade around inside the bollinger bands quite nicely and as you can see it does not like to trade outside of these. Only on rare occasions does this happen. We are again close to the bottom bollinger, and even though the market is very overbought we seem to be holding quite well.


WHAT IF YOU KNEW WHICH WAY THE MARKET WAS ABOUT TO MOVE BEFORE IT HAPPENED?  CLICK HERE To Join Our VIP ELITE GROUP  -- FREE!


Powered by 123ContactForm | Report abuse

Vix Chart

vix chart

The vix seems to be holding its pattern for now, below 12 is bearish, above 14 is bullish. Its seems we are coiling before the next move higher or lower right now, so this will resolve very soon.

vix chart
vix chart


WHAT IF YOU KNEW WHICH WAY THE MARKET WAS ABOUT TO MOVE BEFORE IT HAPPENED?  CLICK HERE To Join Our VIP ELITE GROUP  -- FREE!


Powered by 123ContactForm | Report abuse

Thursday, 25 July 2013

Nasdaq Chart - Bullish Flag

Nasdaq Chart - Bullish Flag

Right now on the daily NASDAQ chart you can see we have consolidated a little, and over the last several days we could have created a little bullish flag. Normally these precede a rise in price, but obviously we have not broken out yet, so we shall wait and see.

Nasdaq Chart - Bullish Flag


 WHAT IF YOU KNEW WHICH WAY THE MARKET WAS ABOUT TO MOVE BEFORE IT HAPPENED?  CLICK HERE To Join Our VIP ELITE GROUP  -- FREE!


Powered by 123ContactForm | Report abuse

Good News Is Bad News

Good news is bad news


Good News Is Bad News? Really?

The earnings right now have not been too bad, and there are much talk amongst traders that this is exactly what they were afraid of. Good reports, good economic data and positive earnings are actually bad for the market?

WHY?

Well.... the word taper comes into this equation straight away. Remember Ben Bernankes last speech, he hinted if the coming months worth of data was postive and better than expected they would begin to taper.

So my guess is if this economic data continues to surprise and get better, the fed will start to taper. Remember right now nothing has been done. But if they do start to taper, on this good news, I doubt it would be anything drastic. Probably minimal at best.

We have been watching this very closely, but it has not really affected the market too much right now, but if we get more good jobs numbers, and more positive economic data, there are big warning signs for the market, and as you saw last time, just the hint of the word taper, and the market unraveled a bit. So I think as your read this, where the market is right now, and watching more good news, could be a real WARNING SHOT ACROSS THE BOW so to speak.


  WHAT IF YOU KNEW WHICH WAY THE MARKET WAS ABOUT TO MOVE BEFORE IT HAPPENED?  CLICK HERE To Join Our VIP ELITE GROUP  -- FREE!


Powered by 123ContactForm | Report abuse

Tuesday, 23 July 2013

Warning - Crash The System

Crash the system. 

If you think the economy is going great guns, you probably need to watch this video below. It will really open your mind to what is happening out there at the moment.

Since the financial crisis back in 2008 and the investigations after we can see how much the markets, and financial systems have been manipulated.

Now days, these guys behind the curtain are planning something big, to ensure more people do not wake up to this shocking reality. My guess is their plan is working....well for now anyway..

Warning this is a 30 minute video, but I do suggest you grab a coffee and take a listen, its the truth about what is happening in gold, silver and the economy right now.


  WHAT IF YOU KNEW WHICH WAY THE MARKET WAS ABOUT TO MOVE BEFORE IT HAPPENED?  CLICK HERE To Join Our VIP ELITE GROUP  -- FREE!


Powered by 123ContactForm | Report abuse

Daily Transports Chart

Daily Transports Chart

The Daily Transports chart has been in a solid uptrend channel since the end of JUNE this year. YES! we are overbought here, and we are watching this chart, but still no clear sell signals have formed as you can see below.

There are alot of earning this week, and we are only half way through. So it will be interesting to see what happens towards the end of the week. But again the transports are the leader of the market, and so far still holding quite well. 


Daily Transports Chart


WHAT IF YOU KNEW WHICH WAY THE MARKET WAS ABOUT TO MOVE BEFORE IT HAPPENED?  CLICK HERE To Join Our VIP ELITE GROUP  -- FREE!


Powered by 123ContactForm | Report abuse

Saturday, 20 July 2013

jp morgan gold depository fire

jp morgan gold depository fire

WHILE SOME SMELL SMOKE,... I SMELL BULLSHIT! 

This is such bullshit people, and I had to post for our members and readers of our blog.

First  JP MORGAN could not commit and deliver on the physical contracts their customers have been demanding lately. HAHA.... NOW THIS!  SURPRISE SURPRISE!

The next piece of news from them, will be more bullshit of course, it wont be funny. What...Damaged Gold? Gold missing? Cannot deliver any more gold for months? hahhahaha this is such a joke.

GUESS WHAT! - All the gold that wasn't there, has now burned up! Good thing it was insured...

FANCY THAT!!....HAHA!

And there we have it, watch this video below to see the bullshit happening live today....

jp morgan gold depository fire - VIDEO BELOW


Have to hand it too these criminal bankers, and elite in control, it was a good try! We are really seeing how evil and to what lengths these criminals will go to in this on going financial crisis. These guys are lower than criminals rotting away in a small jail cell! 

They could have come up with something better than this. And their timing for this couldn't have been worse, with the pressure JP MORGAN have come under lately! LOL. I mean....seriously, these guys are Silly fools at best! 

Maybe this event will cause more people to wake up to the REALITY to what is going on around us and the TRUTH to what is happening in the financial world. 

WHAT IF YOU KNEW WHICH WAY THE MARKET WAS ABOUT TO MOVE BEFORE IT HAPPENED?  CLICK HERE To Join Our VIP ELITE GROUP  -- FREE!


Powered by 123ContactForm | Report abuse

Friday, 19 July 2013

pennant chart pattern - Euro pennant chart pattern

pennant chart pattern - Euro pennant chart pattern

I will keep it quick today!, There looks to be a pennant chart pattern on the EURO right now.

We are still in the triangle formation, however these pennant chart pattern formations are seen as bullish patterns! So we could be looking for a breakout to the upside in the EURO very soon! Time will tell.

pennant chart pattern


WHAT IF YOU KNEW WHICH WAY THE MARKET WAS ABOUT TO MOVE BEFORE IT HAPPENED?  CLICK HERE To Join Our VIP ELITE GROUP  -- FREE!


Powered by 123ContactForm | Report abuse

Thursday, 18 July 2013

Detroit becomes largest US city to file for bankruptcy

Detroit becomes largest US city to file for bankruptcy


Detroit becomes largest US city to file for bankruptcy


Once the very symbol of American industrial might, Detroit became the biggest U.S. city to file for bankruptcy Thursday, its finances ravaged and its neighborhoods hollowed out by a long, slow decline in population and auto manufacturing.

The filing, which had been feared for months, put the city on an uncertain course that could mean laying off municipal employees, selling off assets, raising fees and scaling back basic services such as trash collection and snow plowing, which have already been slashed.

"Only one feasible path offers a way out," Gov. Rick Snyder said in a letter approving the move.

Kevin Orr, a bankruptcy expert hired by the state in March to stop Detroit's fiscal free-fall, made the Chapter 9 filing in federal bankruptcy court.

Michael Sweet, a bankruptcy attorney in Fox-Rothschild's San Francisco office, said the city would pay current employees. But "beyond that, all bets are off."


"They don't have to pay anyone they don't want to," Sweet said. "And no one can sue them."

What I want to say here is this does not surprise me! Oh, and by the way this is not an accident, because the elites are wanting this to spread across to all states in the US.

I have said it many times before, but we are not in a recovery right now. The powers that be want to create massive debt, and they want to bring down all the currencies of the world at one time and at the same time want to decimate cites and businesses as well.

Call me crazy if you like, but this is just a taste of what is too come. The long slow draw out collapse, still does its damage, but hides and leaves people in a false sense of security, and before they know it the rug is ripped right from underneath them. I think this is building up for something big in 2014, but we shall see.


  WHAT IF YOU KNEW WHICH WAY THE MARKET WAS ABOUT TO MOVE BEFORE IT HAPPENED?  CLICK HERE To Join Our VIP ELITE GROUP  -- FREE!


Powered by 123ContactForm | Report abuse

Wednesday, 17 July 2013

Bernanke Makes His Move

The Dow Jones Right now is coiling, I believe before higher prices coming. This looks like a horizontal (bullish) flag.

For Exact levels and targets...  CLICK HERE

dow jones chart

The minutes of the fed meeting was issued today. 

 The Federal Reserve’s proposed timetable for tapering its $85 billion-a-month bond-buying program is not set in stone, Chairman Ben Bernanke said on Wednesday in fairly dovish prepared remarks to a Congressional panel.

“I emphasize that, because our asset purchases depend on economic and financial developments, they are by no means on a preset course,” Bernanke said in remarks prepared for delivery to the House Financial Services Committee.

I can some all this bullshit up in 1 clear sentence. ARE .....YOU......READY!?

If Q2 GDP comes in below 1% as some good economists are predicting , there's no chance he cuts the money off.

There I SAID IT. LOL. Pretty simple really.

But what I think does not matter, because I am just a small voice who owns a small little blog out there somewhere in cyberspace.

It will be interesting to see what happens, because if you think the economy is getting better, and we are seeing a recovery, well, you may need to stop taking that heavy dose of Prozac.


WHAT IF YOU KNEW WHICH WAY THE MARKET WAS ABOUT TO MOVE BEFORE IT HAPPENED?  CLICK HERE To Join Our VIP ELITE GROUP  -- FREE!


Powered by 123ContactForm | Report abuse

Tuesday, 16 July 2013

world trade center truth

world trade center truth


world trade center truth


world trade center truth video Below. Click Play To Watch.

This video finally goes to length about the world trade center truth , and reveals how and why this happend, and also how this could be tied to the financial crisis even in 2008. Very disturbing, but a must watch.

world trade center truth - VIDEO BELOW. 


world trade center truth


WHAT IF YOU KNEW WHICH WAY THE MARKET WAS ABOUT TO MOVE BEFORE IT HAPPENED?  CLICK HERE To Join Our VIP ELITE GROUP  -- FREE!


Powered by 123ContactForm | Report abuse

Sunday, 14 July 2013

fed taper - fed taper and the markets

fed taper and the markets

fed taper
fed taper

As you can see the above chart shows just how volatile the market has become since Ben Bernanke got up and talked about the fed taper plans later this year. We have to remember again, that nothing has actually been done yet, but still the market is defiantly becoming a volatile beast. One week it is down on the next week skyrocketing. Most investors do not know what to think.

If the Federal Reserve begins pulling its irons out of the stimulus fire in September, the resulting rocketing of the dollar and accompanying deflation will lead the Fed to reverse course by early 2014.

So says Jim Rickards, managing director of Tangent Capital.

September tapering could also spur a rally in the dollar as well. But it is obvious to me that the fed really does not have a good plan at all.

The central dilemma: The Fed is feeling heat to ratchet down its $85 billion-a-month bond-buying program, which pressures the dollar because it is tantamount to printing money. Hawks are worried about asset bubbles and systemic risks. Growing speculation that the Fed would taper in September sent the dollar index to three-year highs early this week.

I do not buy all these tapering talks about September being D DAY! YES! I really do not think it is gunna happen. The reason is that there is probably more negative economic data coming down the pipeline, and if that is the case, the fed will have no other option but to continue with his massive stimulus program. It is a sad reality I know, however it is what it is. Eventually its going to end up with the implosion of the markets and also the economy, but we will save that post for a later date.

"However, if the Fed does taper in September, they will find the economy sinks much faster than expected and ... they will have to increase asset purchases by early 2014," he said. But it's September or nothing for tapering I think right now.

It seems that right now the fed are trying to fine-tune everything in a complex system, and that's impossible, infact it is almost like they are setting us up for our own ultimate demise, and putting it on autopilot and even sending us a note in the mail!


WHAT IF YOU KNEW WHICH WAY THE MARKET WAS ABOUT TO MOVE BEFORE IT HAPPENED?  CLICK HERE To Join Our VIP ELITE GROUP  -- FREE!


Powered by 123ContactForm | Report abuse

Friday, 12 July 2013

Rocketship Rally

Rocketship Rally? - Or Is This A Top?

There is a lot of division amongst traders right now to whether this is the start of another upwards burst run on the market, or is this just the top of the market right before a big sell off or CRASH like some pundits out there are predicting. Right now, the most astute thing you can do is just take each day as it comes.

We Explain More Here In Our VIP SECTION! =>  CLICK HERE 

No one is Nostradamus and can predict where the market will defiantly go today, tomorrow and also next week, however As sentiment traders we have found that over the years making money always comes easily when you stay with the smart money or where the main sentiment seems to be from week to week. This is not only a smart thing to do, but is very profitable 99% of the time. You are giving yourself a higher probability of winning and lowering your chances of seeing losses come to your account.  The S&P 500 weekly chart below is a doozy, because as you can see the smart money has been buying dips, so if you have been doing this, there is not reason why you should not be making money.

This can change at any time, however if you view the weekly S&P chart below you can see that we have been in an upwards channel since the start of 2012. This year (2013) has been an amazing year for the bulls, and as you read this, the market again closed up 2% to close out the week as Bernanke's dovish tones stopped the market participants panicking about his previous comments about tapering off the money stimulus that has been flooding these markets since 2009. This week we have hardly saw much selling at all, and people trying to get short, pre-emting a top must be feeling very frustrated.

Things never go up in a straight line, however our rocket man below has been thrust back into his seat and can feel the true raw power of a BULL MARKET, where you get higher lows, and higher highs, so far we have seen a higher low in JUNE, so are we about to see a HIGHER HIGH now? Well that could most certainly happen, and things are heating up and it is only a matter of time to see where these full force bulls can take us?


WHAT IF YOU KNEW WHICH WAY THE MARKET WAS ABOUT TO MOVE BEFORE IT HAPPENED?  CLICK HERE To Join Our VIP ELITE GROUP  -- FREE!


Powered by 123ContactForm | Report abuse

Thursday, 11 July 2013

2013 economic recovery - Is the 2013 economic recovery real

2013 economic recovery - Is the 2013 economic recovery real?

2013 economic recovery


This is a decent question and there is only one real answer. NO! the 2013 economic recovery is not real.

Here is why.....

Since the fed announced this whole tapering of stimulus it has crated alot of volatility  in the markets. Basically the markets believe that the fed had an exit strategy for tapering the Quantitative Easing and after the bond bond buying program it would take some poor data to take them off course for them to do that.

Right now Ben Bernanke says it is going to take lots of positive data to even think about tapering off. There are some fed board members who think the US is strong enough to come off life support but other members like Bernanke who think it might be too soon to be doing that and they want to be sure that the recovery in the US is strong enough to take some of the accommodation away. What they are worried about is the the fact that long term rates are moving higher which pushes up mortgage rates also. The whole recovery in the US seems to be based on a fake stimulus that is not even working.

Also since the 2008 crisis, this so called come back in the housing markets is not real as well, and the fed do not want to kill that, they want to keep the false sense of security out there going, and make it seems like the housing market and stock market are recovering together. So far this play is working very well.

Right now the story is playing out perfectly, even though there still is a real divide right now Bernanke is the only real one calling the shots. He is not in any hurry to take away the accommodation and kill this so fake recovery yet. That would be catastrophic no doubt.

As you can see right now, the markets are extremely sensitive to what the fed and any central banker has to say about quantitative easing and the fact that they want to start tapering off soon. This week, Ben gave no assurances that tapering could occur at all and the market skid up higher. Again this is proof that we are going to see lots of reaction to talks about tapering and quantitative easing in the coming months.

Bernanke was clear that they want to see more recovery in the jobs market first. So it safe to say the FED opinions have altered quite dramatically in the last 24 hours.

Half of the FOMC policy makers do believe the US economy is showing signs of recovery and strength and it is showing up in some of the job numbers we saw last week. However the doves of the FED believe it is not quite there yet and they want to see more evidence that this 'fake recovery' is self sustaining.

The IMF have lowered the US growth for the coming 12 months. Also other major investment banks have lowered their forecasts for the US, so there is very much a differing of opinions right now as to where the US is really heading.

We all know the truth, this so called 2013 economic recovery is a NOT A REAL RECOVERY at all, in fact, it is nothing more than a fairy tale story we keep hearing on the TV and on the radio every day. People keep believing in the fairy tale because they keep getting told what they want to hear. But pumping up the real economy by printing money out of thin air is only going to end in tragedy, you do not have to be Nostradamus to predict this will happen.

 It is not a matter of if it will happen, but now only when this will happen. No one expects things to crumble, but they will crumble at a time when most people do not expect it, that is how the global elite steal from the poor to pay the rich again and again.


WHAT IF YOU KNEW WHICH WAY THE MARKET WAS ABOUT TO MOVE BEFORE IT HAPPENED?  CLICK HERE To Join Our VIP ELITE GROUP  -- FREE!


Powered by 123ContactForm | Report abuse

Wednesday, 10 July 2013

Ben Sends Market Higher

Ben Sends Market Higher


Well I did not bother to stay up and watch the FOMC meeting, because I knew whatever came spewing out of Ben Bernanke's mouth would be either horseshit, or bullshit! LOL. Take your pick, I am not sure which one is more potent. LOL.

Anywhoo...After reading his comments, and the FOMC minutes it is evident that the officials want to see more evidence of recovery in the jobs markets before tapering the current stimulus program. They want to keep inflation at around 2% but the FED Board is split over when they should start to taper or cut back their massive stimulus support program.

As you can see the market did like Ben Bernankes comments, and we have been skidding up higher on the S&P 500 in the last few hours. Bears are still hating this market, but the charts do not lie. There is no doubt about it, the S&P looks very strong right now.


WHAT IF YOU KNEW WHICH WAY THE MARKET WAS ABOUT TO MOVE BEFORE IT HAPPENED?  CLICK HERE To Join Our VIP ELITE GROUP  -- FREE!


Powered by 123ContactForm | Report abuse

Tuesday, 9 July 2013

Most Hated Bull Market Ever

Most Hated Bull Market Ever


Most hated bull market ever


If this is the most-hated bull market ever, as has been suggested, maybe there's good reason for it.

While the rally this year looks good on paper—as any 15 percent S&P 500 gain by early July would—it has come on the backs of some of the ugliest internals you could imagine.

Just look at the qualities the biggest gainers share: Low price-to-earnings ratios, zero dividend yields, high short interest and lowest analyst ratings.

I can see lots of bloggers, and other news and analysis telling their readers that this market is bearish, and we are about to crash hard. I have been hearing that for many months now.

The sad news for these people is that they are not looking at the market hard enough. When you have a look at the chart below you see that we have been in a bull market for many months now, and there is no letting up. I have said it before and will say it again, when you see a chart go from teh bottom left to the top right, that is NOT A BEARISH CHART at all. 

Below is the SPX weekly charts. There is nothing bearish about this chart, and every time there is a major dip on the market, it is just a mere buying opportunity. Since the end of 2011, you can see that we have been travelling up in a upwards channel. 

In no way am I saying we wont see a nice sell off or a larger correction, however I am saying that this chart is more likely to up over time, and for us to see higher prices down the track. Especially in 2013. 

Now I could be wrong and we could see a sell off right back down to the 1050 level, however that would be the very low probability is all. 

Most Hated Bull Market Ever


WHAT IF YOU KNEW WHICH WAY THE MARKET WAS ABOUT TO MOVE BEFORE IT HAPPENED?  CLICK HERE To Join Our VIP ELITE GROUP  -- FREE!


Powered by 123ContactForm | Report abuse

Monday, 8 July 2013

Financial Sector Is HOT

Financial Sector Is HOT

I was taking a look at the financial sector today, and its looking hot. Especailly since the the 4th of JULY. It is obvious to me, that right now after the smart money was dumping these stocks, they are starting to warm up to them, and invest in them again!

Further evidence on the chart below, suggests that the financial sector has broken its falling resistance line and we are up at the 20 mark. MACD has also moved to a buy signal on the daily suggesting further upside will probably be seen soon.

financial sector chart
Financial Sector Chart

WHAT IF YOU KNEW WHICH WAY THE MARKET WAS ABOUT TO MOVE BEFORE IT HAPPENED?  CLICK HERE To Join Our VIP ELITE GROUP  -- FREE!


Powered by 123ContactForm | Report abuse

Bonds Chart - The Downdraft Continues

As you can see on the Bonds daily chart, money has been hopping out in droves, and we are in a downwards channel. We expect this to continue, as the fed news comes out later in the week, and the tapering rumors continue.

As you can see on the chart below, since the 1st of MAY 2013, we have seen lots of money heading for the exits.


WHAT IF YOU KNEW WHICH WAY THE MARKET WAS ABOUT TO MOVE BEFORE IT HAPPENED?  CLICK HERE To Join Our VIP ELITE GROUP  -- FREE!


Powered by 123ContactForm | Report abuse

Saturday, 6 July 2013

fed tapering - treasuries yield chart

fed tapering

The fed tapering news has many investors scrambling for the exits recently. But realistically, is this really a reason to panic?

We have to remember that the FED have not done anything yet, it is all just rumors and speculation. The fed have also announced that they will not be winding / tapering back if the economy is stagnant, and they do not see improvement in the jobless rates. So you have to admit all this panic is over speculation and rumors, something the government thrives and get their jollies from! ;-)

There has been alot of talk recently about the fed tapering, and also what this has done to yields on the market. It seems to be becoming a lucrative vehicle yet again!

As you can see since the news of fed tapering or winding back of fed stimulus a few months ago, investors have been looking somewhere safe to put their money. That seems to be in yields as they have gone up dramatically in the last few months. As you can see below, the 10 year has gone from 16 all the way up to 27 on the close friday.


treasuries yield chart
With more rumors and speculation, we would not be surprised to see yields continue to spike upwards in the coming months. But again, caution must be taken, as the fed keep putting rumors and news out there, and what everyone is forgetting is news and rumors are just that. Not a thing has been done to the mysterious money they keep pumping the market with. Where is it coming from? Mid air right? YES! eventually that will have to come to an end...I agree with that, but it has not happened yet, and we are still in a bull market no doubt.


WHAT IF YOU KNEW WHICH WAY THE MARKET WAS ABOUT TO MOVE BEFORE IT HAPPENED?  CLICK HERE To Join Our VIP ELITE GROUP  -- FREE!


Powered by 123ContactForm | Report abuse