Web Statistics April 2013

Tuesday, 30 April 2013

Sell In May - Is It Really SELL IN MAY this time

Sell In May - Is It Really SELL IN MAY this time around in 2013.

The last few years SELL IN MAY worked particularly well. But the market took a quick rally late in APRIL this year in 2013, so is it SELL IN MAY this year?

When we take a look at the charts, we can see since the middle of april, we rallied up and hit the high 1500's on the S&P and as I type this the S&P is exactly at the year highs again. So we are at a make or break area here. Break out and we could be off to the race, but if the bears come back there could be serious trouble in MAY, so doing this analysis here is a good exercise. We certainly are at at cross roads!!!


spx daily chart
spx daily chart


When we take a look at the SPX weekly chart, there seems to be warning bells alarming. Even though we reallied up nicely on the S&P the last few weeks, the weekly charts seem to be suggesting we are very overdone on the buying side. 

Maybe with all this buying going on, the traders are not looking at charts like this, and have been lulled into a false sense of security. Anyway, the markets do not really care about anyone right now, and looking at the weekly, it is telling us to be very cautious, and also telling that a correction on the market is not only overdue, but possibly coming down the track. Will this occur in MAY, who knows, but looking at the weekly chart there is certainly a case to be on alert that is for sure. 

I am sure the private funds and equity firms had tightened up their stop losses, and sold out of massive profitable positions right now. That would be the astute thing to do looking at the weekly chart anyway. 

spx weekly chart
spx weekly chart

Sell in may ? well we will find out soon. But things are a little over done on the buy side looking at these charts anyway. We are not screaming to SELL IN MAY, but can see a cause for anyone who is doing this at the moment.

HAPPY TRADING. :-)

WHAT IF YOU KNEW WHICH WAY THE MARKET WAS ABOUT TO MOVE BEFORE IT HAPPENED?  CLICK HERE To Join Our VIP ELITE GROUP  -- FREE 10 Day Trial Offer Today!


Powered by 123ContactForm | Report abuse


For all other enquiries ==>  CLICK HERE TO CONTACT US


stock trading information - 5 important tips

stock trading information - 5 important tips

stock trading information


stock trading information - Loss/Gain Proportion

Set up an acceptable loss/gain proportion and stick to it. For example, a 1:3 proportion would mean that you would be willing to lose $1000 to possibly gain $3000. Once you decide the proportion you are comfortable with, stick to it; part of the success of day trading is not being impulsive but keeping to a set of rules that works for you.

stock trading information - Overcome Doubt and Hesitation

Long-term investors have the luxury of watching the market for days, months or even years; this is not the case for day traders. To become a successful day trader you must have the ability to move on a dime and dive into a trade within minutes, while the trend is still active. Those who hesitate often miss the favorable trend or invest too late and lose money.

stock trading information - Train Before You Enter the Big Race

Even though you may be really excited about the prospect of making fast money in day trading, keep in mind that you can also lose money fast. Becoming a successful day trader depends on being able to recognize trends quickly, it is a good idea to study as much as you can and take advantage of virtual or simulating trading platforms before you invest your hard-earned savings.

stock trading information - Master Your Trading Tools

Day trading software and online trading services offer powerful trading platforms and tons of market information. It is a good idea to take the time to figure out how you can make your trading software work for you, many offer market analysis and trend tools, charts, watch lists, alerts, graphs and much more that can help you become a shrewd and efficient trader.

stock trading information - Decide Whether You Can Become a Full or Part-time Day Trader

Often day traders evolve from full-time stock brokers or others that have heavy experience in the market. Since day trading may involve great losses of money in minutes, many have to make the choice to become full-time day traders. Though you can dabble a bit into day trading, it is not worth your money or time if you do not have the time to watch the market constantly or execute your trades exactly when needed. If you decide to become a part-time day trader or to “play” a bit with day trading, be sure that you have the funds to support it.

Day trading can be amazingly challenging and exciting, but just like all games of risk it is important that you walk into the game knowing the rules, your odds and just how much you are willing to risk. Day trading is a game of chance, quick-wittedness and courage; if you think you have what it takes, suit up and enter the game − you may just win.

Hopefully this stock trading information will help you become a better trader and increase your profits over the next 12 months. Happy trading :-)

WHAT IF YOU KNEW WHICH WAY THE MARKET WAS ABOUT TO MOVE BEFORE IT HAPPENED?  CLICK HERE To Join Our VIP ELITE GROUP  -- FREE 10 Day Trial Offer Today!


Powered by 123ContactForm | Report abuse


For all other enquiries ==>  CLICK HERE TO CONTACT US


Saturday, 27 April 2013

spx weekly chart - spx weekly chart range

spx weekly chart

The spx weekly chart seems to be trapped in an annoying range. The whole time many pundits and analysts are saying the market will rise or the market is about to crash, the market spat in their faces and has not really been doing much at all.

We think the levels....... VIP MEMBERS ONLY - Click Here

We will note that weekly chart seems to be wayyyy overbought here, and volume is lacking on positive days, previously that has been a warning sign.

Technically if we get below the 1550 level on the SPX that will bring in more sellers, and as we are in overbought conditions the sellers could come in hard and fast. However seasonally we are in April that can be a slow time in the market. Normally things start to heat and move more freely in MAY.


spx weekly chart
spx weekly chart


WHAT IF YOU KNEW WHICH WAY THE MARKET WAS ABOUT TO MOVE BEFORE IT HAPPENED?  CLICK HERE To Join Our VIP ELITE GROUP  -- FREE 10 Day Trial Offer Today!


Powered by 123ContactForm | Report abuse


For all other enquiries ==>  CLICK HERE TO CONTACT US


BONDS DAILY CHART

BONDS DAILY CHART

The bonds daily chart is popping out of an ascending triangle. In our books this is seen as being quite bullish. If we take out the buy stops sitting higher, we are likely to see 1.34 and 1.35 levels coming for bonds.

The ascending triangle has been building for a few weeks now and this ascending triangle almost looks textbook. There is a treasuries announcement on the market next week and we will be waiting to see what happens there and will update the bonds chart then.


WHAT IF YOU KNEW WHICH WAY THE MARKET WAS ABOUT TO MOVE BEFORE IT HAPPENED?  CLICK HERE To Join Our VIP ELITE GROUP  -- FREE 10 Day Trial Offer Today!


Powered by 123ContactForm | Report abuse


For all other enquiries ==>  CLICK HERE TO CONTACT US


The TRIN chart

The trin chart is the opposite to the market, and we have seen the TRIN rally for the last two days, and that could be a warning sign that a dip might be coming on the market.

If we head towards 3 or even 4 on the TRIN that will not bode well for the markets. We will monitor this and see what happens.


WHAT IF YOU KNEW WHICH WAY THE MARKET WAS ABOUT TO MOVE BEFORE IT HAPPENED?  CLICK HERE To Join Our VIP ELITE GROUP  -- FREE 10 Day Trial Offer Today!


Powered by 123ContactForm | Report abuse


For all other enquiries ==>  CLICK HERE TO CONTACT US


Thursday, 25 April 2013

Plan to Jail Bankers Who Behave Recklessly

Plan to Jail Bankers Who Behave Recklessly

A new bid today - Plan to Jail Bankers Who Behave Recklessly

But Will this really work??


Plan to Jail Bankers Who Behave Recklessly


From CNBC

Today a plan to jail Bankers who behave recklessly would be jailed under a new law being considered by MPs and peers on the banking commission, whose final report is due next month.

Several members of the commission, which was set up by George Osborne after the scandal over the London Interbank Offered Rate, argue for a new law which would hold bankers personally liable for catastrophic losses.

One member told the Financial Times: "Banks benefit from a public subsidy, in that they know they will be bailed out if they fail. I think we want to see a sense of personal responsibility to match that."

Andrew Tyrie, the Conservative MP chairing the commission, is close to completing a draft report with the final version due at the end of May.

Mr Osborne set up the commission to look into all aspects of bankers' behaviour, under heavy pressure from Labour, and will find it difficult to reject its recommendations. A Plan to Jail Bankers Who Behave Recklessly is a good thing and they can be made an example of to other willing bankers who are thinking of doing the same thing.

In an interim report into the failure of HBOS, published three weeks ago, the commission signalled its focus on holding bankers personally responsible for their misdeeds.

"Those responsible for bank failures should be held more directly accountable for their actions and face sanction accordingly," the report said.

The interim report stopped short of recommending more punishment for the individuals involved. Nonetheless, within days, Sir James Crosby, the bank's former chief executive, had asked that his knighthood be removed and that his pension entitlement be cut by a third. Fred Goodwin, the former chief of Royal Bank of Scotland, was stripped of his knighthood last year, amid a long-running outcry over his role in the collapse of RBS.

A new "reckless endangerment" law would be modelled on the US system, where executives can be prosecuted for putting public health or safety at risk through decisions taken at work. We have seen what the bankers did to the economy in 2008 so a Plan to Jail Bankers Who Behave Recklessly is a good idea.

The commission is split on the idea. Some believe it is the best way to make clear that the rights which bankers enjoy to government support should be matched by more responsibilities than executives have in other industries.

Others, however, worry that the proposed law could hamper lenders' daily business, and hinder growth by forcing bankers to become too conservative in their lending and trading decisions.

One commission member said: "We are agreed on most of our proposals but this one has us genuinely split."

Mr Tyrie did not respond to a request to comment.

If the panel does call for such a rule, it could find support at the top levels of government. David Cameron, prime minister, called for such a move in 2009, when he was in opposition. Mr Cameron said at the time: "We need to look at the behaviour of banks and bankers, and where people have behaved inappropriately, that needs to be identified, and if anybody has behaved criminally, in my view, there is a role for the criminal law."

That idea has since been backed by Matt Hancock, the business minister and a close ally of Mr Osborne, who said last year: "The penalties for irresponsible behaviour at such banks must be strengthened."

The panel is also considering other proposals that could remodel the financial services sector.

One is to enforce what one member called an "internal Glass-Steagall split", which would require banks to separate their trading functions from the rest of their operations.

Under this system, riskier trading activities would be overseen by a separate chief executive, with the bank's overall CEO in charge of making sure that governance is upheld across the group.

"This would in effect turn banks into conglomerates, and protect savers if the riskier side blows up," said one member of the commission.

This suggestion could, however, be vetoed by ministers, who have instead told banks to enact a so-called ring fence to segregate high street and riskier investment banking.

Another key recommendation being considered by the commission would see the pay of miscreant bankers more directly hit. In addition to bonus clawback measures which have become widespread at banks, commissioners are looking at other structures that would allow pay to be docked in the event of disaster. A Plan to Jail Bankers Who Behave Recklessly would not only be a good thing, but it would make members who have high paying jobs to think twice about their high ranking and power, and how to use it more effectively.


WHAT IF YOU KNEW WHICH WAY THE MARKET WAS ABOUT TO MOVE BEFORE IT HAPPENED?  CLICK HERE To Join Our VIP ELITE GROUP  -- FREE 10 Day Trial Offer Today!


Powered by 123ContactForm | Report abuse


For all other enquiries ==>  CLICK HERE TO CONTACT US


gold weekly chart - gold bugs index

This is not the gold weekly chart,  however this chart is even better as it tracks the gold and metals index. This chart is the gold bugs index, and a chart that all gold investor need to watch in the coming weeks.

Alot of people are calling for a bottom in gold, although looking at this chart that is not only dangerous, but the weekly charts are best to determine these sort of calls, and so far gold does not look healthy. There might be some bigger calls out in the webosphere to buy gold here, but the charts, meaning MACD and stochastics (great indicators) are not giving us a nudge yet.  We would not be surprised to see lower prices in gold come, but this is a trade we are watching very carefully and keeping our  VIP ELITE GROUP members alert here

This was a very manipulated crash down in gold, and the smart money has performed this so they can get back at a nice healthy price.

gold weekly chart
gold weekly chart


WHAT IF YOU KNEW WHICH WAY THE MARKET WAS ABOUT TO MOVE BEFORE IT HAPPENED?  CLICK HERE To Join Our VIP ELITE GROUP  -- FREE 10 Day Trial Offer Today!


Powered by 123ContactForm | Report abuse


For all other enquiries ==>  CLICK HERE TO CONTACT US


Wednesday, 24 April 2013

ascending triangle on bonds - hmmmmmmm

Taking a look at the 10 year bonds, we can see that the highs just under the 133 line have held really well. So much so, that we would not call this the resistant line on an ascending triangle.

See how both the sellers and buyers are now being squeezed and we  have a very very tight range. Normally ascending triangles are bullish patterns, and we shall see what happens in the next few days.

A breakout in the upwards direction on bonds, to the 133 - 134 area will again put pressure on the market.


ascending triangle pattern on bonds


WHAT IF YOU KNEW WHICH WAY THE MARKET WAS ABOUT TO MOVE BEFORE IT HAPPENED?  CLICK HERE To Join Our VIP ELITE GROUP  -- FREE 10 Day Trial Offer Today!


Powered by 123ContactForm | Report abuse


For all other enquiries ==>  CLICK HERE TO CONTACT US


Tuesday, 23 April 2013

risks associated with social media - hackers trick wall street

risks associated with social media

While many people believe there are huge benefits of using social media, today we were witness to the darker side of social media, and also the many risks associated with social media especially to do with the online trading world.

US stocks ended a tumultuous day with strong gains after a false tweet briefly sent financial markets veering, underscoring technology's role in tightly linking global markets.


risks associated with social media - Hacker Sends Out Tweet


The fake tweet sent the stock market scurrying down, and had Authorities panicked Tuesday not knowing what to do. (see below)

risks associated with social media - Market Crashes after tweet sent


In 2013, many profitable traders use social media to share ideas, pass around charts, and link to sites that could increase there chances of profiting in and around the global markets. However we must understand that there is a darker side to social media, that is not getting much attention at all. This mishap, or what is being termed a vulnerable social media aspect to the market should be a "wake-up call" to regulators that social media presents a major threat to not only the general public, but also to the investing communities and other traders who use social media as a way to communicate during their trading day.

Today's event brought back horrific memories of the FLASH CRASH that occurred back in May 2010, after a hacker allegedly accessing the Associated Press Twitter account  and posted a fake message about  bombs and explosions going off at the white house.

As you can see the market skid down instantly, and fortunately social media was powerful enough to correct this mistake via the news networks, that this message was indeed a fake tweet sent by a malicious hacker.

In 2013 we understand and realize the true power in social media, but if social media has the power to affect wild swings on the stock market  at what point do we stop and say "who did this, and why is there not some authoritative figure regulating this?" These are valid questions!

While there is no quick fix, or easy answers here, today was surely a wake up call for WALL STREET professionals, and traders to stop and think about those who do use social media in harmful way.

We have to understand there are some traders and data houses that are purely using social media feeds and tweets to organize large algorithms and lightning fast high volume trades that can slam the market down hundreds of points very quickly.

The market is an environment that is fast paced, and an entity unto itself. Its a stressful environment for traders at times, and these sorts of added risks should not thrown into the mix and on traders minds as they go about their trading day.

Kevin Ferry, president of Cronus Futures Management, said odd movement earlier in the day by the Standard & Poor's 500 mini futures contract suggested that the AP tweet was planted by a trader looking to make money off it.

You may be skeptical about all this being planned by a trader, however if this were true, it would have been a good day on the market for this tweeter. He only did it because he knew he could get away with it so easily.

We have seen the risks that hackers and social media can have, this problem is not going to go away anytime soon. They are yet to find the person that carried out this attack (fake tweet) however if they were even caught what would happen to them? have they even broke any major laws? At the moment  no one really knows?

As you can see there are many risks associated with social media even in the trading world, and we saw a good example of that today. The dangers of social networking sites are really only now being exposed as these stories are coming to light.

Why is it, that every time we see the darker side of social media sites, like facebook, twitter, linkdin people seem to throw up their hands and say the problems is too hard to deal with and the problem is not easy to navigate a probable solution. Isn't that what these hackers want? To know they hold almighty power at their finger tips, by sending out a 100 character tweet, have the ability to wipe billions off the stockmarket in a matter of seconds and not get into trouble.

Authorities better be thankful that this problem was resolved fast, because next time someone with more advanced skills could do much worse, and no one would be prepared for the aftermath.

Maybe this is a wake call that we all needed, to try and put a stop to more of these outside market influences that threaten the online trading world. Traders have enough on their plate each week than to have to worry about the threat of hackers and fake tweets that could implicate their profits and losses each day. The market is already manipulated enough and traders do not need the worry and hassle of having these sorts of problems in the back of their minds while they are simply trying to get in there and make some money, and then get out.

The hackers had their day in the sun today, they probably did this for fun. YES! They tricked wall street, I will admit it, however we need to understand this situation a little better and learn to put in place solutions so this NEVER happens AGAIN!


WHAT IF YOU KNEW WHICH WAY THE MARKET WAS ABOUT TO MOVE BEFORE IT HAPPENED?  CLICK HERE To Join Our VIP ELITE GROUP  -- FREE 10 Day Trial Offer Today!


Powered by 123ContactForm | Report abuse


For all other enquiries ==>  CLICK HERE TO CONTACT US


Markets Sink Briefly on Fake AP Terror Tweet

Markets Sink Briefly on Fake AP Terror Tweet


Markets Sink Briefly on Fake AP Terror Tweet


FROM CNBC


A news agency tweet, that turned out to be fake about explosions at the White House injuring President Obama, sent markets on a round-trip roller coaster ride.

@AP, the official twitter handle of the respected Associated Press news agency, sent out a message at about 1:07 p.m. ET, saying "Breaking: Two Explosions in the White House and Barack Obama is Injured." The AP quickly said it was hacked.

White House Press Secretary Jay Carney said, "the President is fine" despite what the hacked Twitter feed said.

However, the market impact was already intense. On the floor at the Chicago Mercantile Exchange, traders quickly traded on the tweet, selling S&P futures and buying Treasury 10-year futures. For several minutes, the floor was a flurry of activity, as it was in trading rooms across Wall Street, until the Associated Press tweeted that its account had been hacked.


The Dow plunged more than 140 points and bond yields fell. Within six minutes, the Dow recovered its losses and was trading with triple-digit gains. Reuters estimated that the temporary loss of market cap in the S&P 500 alone totaled $136.5 billion.

In a closely linked trade, dollar/yen also plunged  temporarily to about 98.60, before recovering to a level above 99.

The false tweet comes at a time of hypersensitivity in the markets toward terrorism, following the Boston Marathon bombings. It also highlights the vulnerability of social media and follows on the hacking of media sites and just Sunday, CBS' '60 Minutes'Twitter account.

The Federal Bureau of Investigation, Secret Service and Securities and Exchange Commission were all investigating the tweet.

A group calling itself the Syrian Electronic Army, which is supportive of Syrian leader Bashar Al-Assad, later claimed that it was responsible for the tweet on its own Twitter account. The group has also claimed to have hacked the Twitter accounts of National Public Radio, the BBC and '60 Minutes.'
"You wonder who did it and whether it was done on purpose. It certainly was an instant implosion," said Art Cashin, of UBS shortly after the market recovered. He had watched the minutes of bedlam on the floor of the NYSE and said the reaction was especially dramatic because it said the president was injured.

The rapid fire trading also highlights the role of computers and algorithmic trading on Wall Street.

"That goes to show you how algorithms read headlines and create these automatic orders – you don't even have time to react as a human being," said Kenny Polcari of O'Neill Securities, on "Power Lunch." "I'd imagine the SEC's going to look into how this happens. It's not about banning computers, but it's about protection and securing our markets."

SEC Commissioner Daniel Gallagher later said the agency was looking into it, according to Reuters. The Secret Service tweeted that it was aware of the tweet and would "take the appropriate follow-up."

Other major news agencies did not follow the false tweet, and many major news organizations have representatives at the White House.

"It was really scary and really fast," said Art Hogan of Lazard Capital Markets. "It corrected fast. By the time you realized it happened, it already corrected."

"We're in an environment where we're sensitive to any news that sounds like terrorism," said Hogan. "That makes it that much more believable. That's the tricky part. When something like AP gets hacked, it becomes reality for a period of time, until it's not."


WHAT IF YOU KNEW WHICH WAY THE MARKET WAS ABOUT TO MOVE BEFORE IT HAPPENED?  CLICK HERE To Join Our VIP ELITE GROUP  -- FREE 10 Day Trial Offer Today!


Powered by 123ContactForm | Report abuse


For all other enquiries ==>  CLICK HERE TO CONTACT US


Dow Jones Projections

Dow Jones Projections

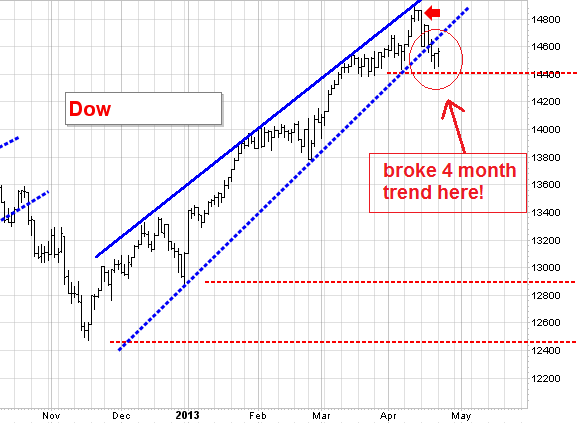
The Dow Jones is an interesting chart. When you take a look you will notice that we have broken a major trendline that has been intact for many months, and now we are getting close to another major support line at about the 14400 level.

The break of the trend is significant for several reasons yesterday we put out a MAJOR UPDATE to our  VIP SUBSCRIBERS - Download it here!

Have we seen a top at the 14800 level. Well, it is probably a little to early to put a definite yes on that at present.

However, you will notice that the break of 14600 was significant and a break of 14400 will probably not be good. The US dollar looks very strong at the moment, and sentiment trader always says the news comes out in the charts first, so maybe we are about to see some not so good earnings and reports come out in the coming weeks?

Anyway, right now I think it is important to watch that lower support level sitting at 14400, that will be key in my book.


dow jones projections


WHAT IF YOU KNEW WHICH WAY THE MARKET WAS ABOUT TO MOVE BEFORE IT HAPPENED?  CLICK HERE To Join Our VIP ELITE GROUP  -- FREE 10 Day Trial Offer Today!


Powered by 123ContactForm | Report abuse


For all other enquiries ==>  CLICK HERE TO CONTACT US


Monday, 22 April 2013

dow jones prediction - barrons scary dow jones prediction

dow jones prediction - barrons scary dow jones prediction


dow jones prediction


So did anyone see the latest dow jones prediction on the cover of barrons magazine lately?

I must say it was very very interesting! (see above)

I could write a complete 20,000 word essay on how I think the mass media, government, banks and other entities have been manipulating this market, but lets focus on this brilliant piece of artwork that circulating its way around the large groups of investors at the moment.

Barrons has just aired their latest dow jones prediction for all to see, and they are calling for dow jones to hit 16,000 on the index very soon. I thought it was amusing they had a bull on a pogo stick jumping over a bewildered bear! HAHA, I did giggle like a school girl when I saw that drawing, I mean it was pretty clever! I love how the mass media and pundits are becoming like the holy bible and spreading the good news like  one of Jesus disciples in the old testament.

I do not subscribe to barrons, but I find it interesting that they do become extremely bullish and bearish at the wrong times! Also they never seem to mention the TRUTH that there is a very bad financial crisis looming soon, it will not come tomorrow, or next month, but somewhere down the track we will become witness to what I believe to be a repeat of 2008, perhaps something much worse. I would probably  label it something along the lines of a FINANCIAL CRISIS 2.0

I do not see these sorts of headlines on the magazine, just market predictions and propaganda for the average trader out there to read.

When I showed this picture above and the dow jones prediction of 16,000 to a fellow trader this morning, he did laugh and then reminded me, that the last two times BARRON'S become super bullish on the market it sold off very hard and was significantly lower several weeks later. It is almost identical to their last DOW JONES PREDICTION call on the market.

Will they jinx the market again? Only time will tell. :-) *insert cheeky smile here* :-P


WHAT IF YOU KNEW WHICH WAY THE MARKET WAS ABOUT TO MOVE BEFORE IT HAPPENED?  CLICK HERE To Join Our VIP ELITE GROUP  -- FREE 10 Day Trial Offer Today!


Powered by 123ContactForm | Report abuse


For all other enquiries ==>  CLICK HERE TO CONTACT US


Saturday, 20 April 2013

Bull Market Rally - Is It Too Late To Enter Now

Bull Market Rally - Is It Too Late To Enter Now In 2013?


The current bull market rally we are currently witnessing in 2013 is quite incredible. Have a look at the bull market indicator below. This is a chart watched by some of the top wall street traders each week. It is called the the bull / bear market indicator. As you can see the current bull market rally started at the very beginning of 2012 and has not slowed down since.


bull market rally
bull market rally


No matter what the pundits and analysts out there are saying, this is a healthy market. If you have come out of stocks in recent times, you might be concerned that you've missed your next opportunity to get back in. After all, they must be costly now that the Dow Jones business average has increased to 120 % in 4 years to a record high.


The first-class news is that stocks still appear to be a good challenge regardless of its run-up. The shocking news: They're no negotiations, at least by some dealings, so don't get too thrilled.
A lot of investors obsess about stock price. But you must give equivalent weightage to a company's income. When incomes rise, stocks turn out to be more valuable & their prices generally rise too.

Among reasons to consider stocks again:

A better powerful economy

Presently there are no symptoms of a recession. However smart investors know the market is totally dislocated away from the real economy anyway. And this is very cheering for stocks, which nearly for all time fall in advance of an economic decline. Stocks started declining 2 months prior to the Great Recession which began in December 2007 & one year earlier than the recession that happened in March 2001.

Until now, the economy could be on the border of quicker growth. The Labor division announced on Friday that the unemployment percent in February dropped from 7.9 % - 7.7 %, it is the ever lowest point since December 2008. Added jobs mean additional money for people to use, & consumer spending boosts 70 % of the economic doings.

If latest history is any guide, this economic development is still little. The growth that started in June 2009 is only 44 months old. The earlier 3 expansions stayed for 73 months, 120 months & 92 months respectively. Corporate incomes grow in expansions, and this can definitely drive stocks higher.

Stocks realistically priced:

Investors prefer using a gauge which is called ‘price-earnings ratios’ in making a decision whether to buy or sell. Low P/E ratios indicate that stocks are low-priced relative to a company's income; high ones indicate that they are costly.

At present P/Es are neither low nor high, signifying stocks are very realistically priced
To compute a P/E, you can divide the value of a stock by its yearly income per share. For an illustration, a company which earns a share of $4 and has stock value $60 has a P/E of 15. The majority of the investors compute P/Es in two ways: based on estimates of income the next 12 months & on income of the past 12 months.

Whatever the P/E you choose, it's vital to consider it as a violent guide at best. Stocks can do business above or below their average P/Es for years.

Positive investors:

A new care for stocks could confirm a dominant force moving the prices up. In actuality, it can move them up even if income doesn't boost.

As stocks have suddenly moved upward over the past 4 years, single investors have been selling, which is almost extraordinary in a bull market rally. But they may also have a second thought. In January, they kept almost $20 billion extra into U.S. stock mutual funds later they took out, as per the Investment Company Institute, a trade group for funds.

Some financial analysts are saying we are at the beginning of a "huge Rotation." That would mean investors are changing money into stocks from bonds. If that takes place, stocks could ascend. Right now however the bonds chart is looking very healthy and the market is also due for a pause, so for patient investors they might have to wait a few months and buy any nice dips (as we are overdue) that present themselves.


WHAT IF YOU KNEW WHICH WAY THE MARKET WAS ABOUT TO MOVE BEFORE IT HAPPENED?  CLICK HERE To Join Our VIP ELITE GROUP  -- FREE 10 Day Trial Offer Today!


Powered by 123ContactForm | Report abuse


For all other enquiries ==>  CLICK HERE TO CONTACT US


Did you Heed our warning

Did you Heed our warning?

A few weeks back we were warning our subscribers that there was sell volume coming into the market. Our VIP MEMBERS HERE got plenty of warning.

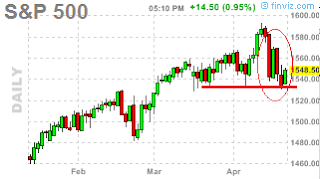
The start of April we did see a short covering rally and the bulls got tricked back into the market, only to find, that days later the market really sold off hard and we are currently back down at the 1540 level.

We posted our update a few weeks ago and warning about how strong bonds was looking and the move up in the S&P could be a phony one. It seems that we were correct. For Proof You can see what we said a few weeks back  ==> THIS POST HERE


warning given to VIP members


Now we did not pick and warn members at the top, however it was close as we did notice that the S&P was lying and BONDS were not. Our VIP members got a more detailed warning.

Right now we think we are at a crucial time in the market. Its make or break time, and the bulls and bears are fighting out a long hard battle, but eventually one side will win.


WHAT IF YOU KNEW WHICH WAY THE MARKET WAS ABOUT TO MOVE BEFORE IT HAPPENED?  CLICK HERE To Join Our VIP ELITE GROUP  -- FREE 10 Day Trial Offer Today!


Powered by 123ContactForm | Report abuse


For all other enquiries ==>  CLICK HERE TO CONTACT US


Friday, 19 April 2013

Is This Time Different - Is This A Dip Or A Sell Off


Is This Time Different? Is This A Dip Or A Sell Off

Dow down 52 points, but S&P 500 up 5 points — huh? IBM is down over $14, responsible for roughly 100 Dow points.

So what is happening? just yesterday we put out a MAJOR UPDATE to our  VIP SUBSCRIBERS - Download it here!     We told them what we thought is happening on the market. 


spx chart
spx chart


Everyone wants to know, Is this time different? The meager three percent pullback in the S&P 500 at the end of February made a lot of traders believe that any pullback should be bought, but there has been a lot of discussion this week that this pullback might be different. The following arguments are being batted around:

1) the technicals are worse: this week has seen two days (Monday and Wednesday) where 90 percent of the volume was on the downside on very large volume; this has led many to question whether we are still in an up trend in the markets;

2) the macros are different: March and early April economic numbers (Philly Fed) have been weak (this is becoming a regular Spring event);

3) tech is in trouble; Fairchild Semi and Sandisk had notable drops yesterday, IBM is down four percent this morning on its earning miss, and Apple is at a new low 52-week low.

However, it's a little early to draw any conclusions from earnings, other than tech disappointment. Early bank reports (JPMorgan and Wells Fargo) were good, but Bank of America disappointed, and multi-industry company reports have been mixed. General Electric was fair but CEO Jeff Immelt noted ongoing weakness in Europe.

As of this morning,104 companies have reported (21 percent of the S&P 500), with 67 percent beating expectations — slightly above the norm. Earnings are 2.0 percent higher than the same period last year, with revenue outpacing last year by 3.2 percent, according to S&P Capital IQ. However, guidance has been cautious to

WHAT IF YOU KNEW WHICH WAY THE MARKET WAS ABOUT TO MOVE BEFORE IT HAPPENED?  CLICK HERE To Join Our VIP ELITE GROUP  -- FREE 10 Day Trial Offer Today!


Powered by 123ContactForm | Report abuse


For all other enquiries ==>  CLICK HERE TO CONTACT US


Thursday, 18 April 2013

The bonds chart

The bonds chart

Taking a quick look at bonds, we can see that over the last few weeks, the bonds have produced an ASCENDING TRIANGLE.

These are seen as bullish patterns and more often then not precede higher prices, especially if we break that top resistance point at 133.40 mark.

If we do break this top resistance, that will probably not bode well for the market.  Time will tell.

bonds chart
bonds chart


WHAT IF YOU KNEW WHICH WAY THE MARKET WAS ABOUT TO MOVE BEFORE IT HAPPENED?  CLICK HERE To Join Our VIP ELITE GROUP  -- FREE 10 Day Trial Offer Today!


Powered by 123ContactForm | Report abuse


For all other enquiries ==>  CLICK HERE TO CONTACT US