Web Statistics The Sentiment Trader
Showing posts with label vix daily chart. Show all posts

Tuesday, 5 November 2013

Vix Holding Pattern

The Vix right now seems to be in a holding pattern right now, you can see on the charts we are just trading in between the support and resistance lines drawn.

We are at 13 and holding and we think it is possible to see the higher teens coming i.e. 14 and higher. If this was to occur it would put a lot of pressure back on the market. Its all about the VIX right now, so this is a must watch for traders.


WHAT IF YOU KNEW WHICH WAY THE MARKET WAS ABOUT TO MOVE BEFORE IT HAPPENED?  CLICK HERE To Join Our VIP ELITE GROUP  -- FREE!


Powered by 123ContactForm | Report abuse

Monday, 28 October 2013

Vix Update - Vix Chart

It simple analysis here, the VIX simply melted back down near the recent lows and is having a hard time still. All eyes are watching wedneday to the FOMC meeting.

This VIX is still being suppressed, and just cant catch a bid at the moment! We feel that the VIX is going to find it a really hard battle to break the 15 - 16 area. Its all about the VIX right now, and now the shut down and debt crisis is over until at least next year the VIX is very telling.

vix chart
VIX CHART


WHAT IF YOU KNEW WHICH WAY THE MARKET WAS ABOUT TO MOVE BEFORE IT HAPPENED?  CLICK HERE To Join Our VIP ELITE GROUP  -- FREE!


Powered by 123ContactForm | Report abuse

Thursday, 3 October 2013

Market update october

Market update October

There is no doubt the GOVT shutdown is having some sort of affect on the market, but it is more directly related to the debt ceiling agreement that is coming up in the next few weeks. We shall see what sort of BS the congress has in store for us then. I always get a good laugh out of their lies, BS and propaganda. Thank goodness that in the VIP MEMBERS AREA HERE  we only  concentrate on all the charts that do matter. It has been a good week for our  VIP MEMBERS  HERE 

Onto the charts.....

With all this downdraft on the markets, you can see that the S&P is in a downwards channel. Things are still favoring the bears, and below 1700 should be bearish, and above this level should be bullish in my eye. We shall see what happens next!

spx daily chart
spx daily chart 

We have been watching the VIX very closely, as a few days ago, we did warn it was staring to look particularly strong! Just look at all the events moving the vix at the moment, pointed out in the chart below. Today we broke 18 on the VIX as you can see, but by the close of the market the sellers came right back. Breaking 18 today, is significant, and does mean two very important things.....

1) Traders are looking for a flight to safety and insuring their bets on the market. 

2) There is a good chance we see higher prices on the VIX soon. 

If these things are true, it will only put more pressure on the stock market and indices.


VIX chart
VIX chart


WHAT IF YOU KNEW WHICH WAY THE MARKET WAS ABOUT TO MOVE BEFORE IT HAPPENED?  CLICK HERE To Join Our VIP ELITE GROUP  -- FREE!


Powered by 123ContactForm | Report abuse

Monday, 30 September 2013

VIX Daily Chart - VIX Daily Chart Warning

VIX Daily Chart - VIX Daily Chart Warning

The Vix daily chart has been quite violent and turbulent in recent times. There is no doubt that the china news and taper delays and now the possible government shutdown and looming debt crisis is playing havoc with these markets. Its quite a tougeful right there, LOL, however you can see that the VIX popped up to nearly 16 last friday, and it means that some investors are looking for safety.

We are now above the 10 MA and 50 MA and there is a real possibility we could go up and touch 17 or even higher.


VIX Daily Chart
VIX Daily Chart


 WHAT IF YOU KNEW WHICH WAY THE MARKET WAS ABOUT TO MOVE BEFORE IT HAPPENED?  CLICK HERE To Join Our VIP ELITE GROUP  -- FREE!


Powered by 123ContactForm | Report abuse

Tuesday, 29 January 2013

Dow Jones Transports Chart - Strong Dow Jones Transports Chart

Have a look at the dow jones transports chart below.

What we have noticed is that our breadth indicator charts have been spot on, as on the chart below, the dow jones trasports chart is showing us that we have hardly even seen one red day on the market this year. WOW!

Over $44 billion dollars has been put into work on the market since the 1st of January, and as  you can see they want to put this money to work, or make it work for them (as they say)

We said at the start of the year, DO NOT FALL IN LOVE WITH THE DOWNSIDE, and now you can see why!.

The DOW JONES TRANSPORTS CHART does look strong, and yes, a top will come soon, however we just look and read charts first, and the dow jones transports chart below is still looking very bullish.
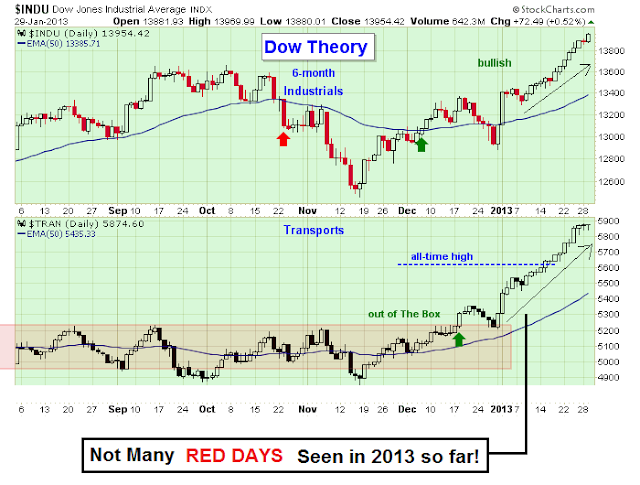
dow jones transports chart


The vix chart below is showing us that it has been very suppressed lately and has struggled to find a bid. As you know the VIX is the inverse trade to the S&P and stock market, it has given the bulls just what they need to keep the market bullish and to keep that $44 billion dollars (we mentioned above) hard at work!!!!!!

Over the last few weeks, the VIX has tested the 14 level, and failed to get above, which has been helping the bulls. 


vix daily chart
vix daily chart


WHAT IF YOU KNEW WHICH WAY THE MARKET WAS ABOUT TO MOVE BEFORE IT HAPPENED?  CLICK HERE To Join Our VIP ELITE GROUP  -- FREE 10 Day Trial Offer Today!