ACCESS OUT FULL PREMIUM ELITE VIP NEWSLETTERS & UPDATES!
See What The Fuss Is About - Try Us Free For 14 Days! - Limited Time Offer - Hurry!
Get access to our Daily analysis, videos, coaching, audio, charts and indicators AND MORE....=====================================================
oil price trends ?
 |
| OIL PRICE TRENDS |
U.S. crude oil price trends closed lower in choppy trade, but still recorded weekly gains, as supply disruptions in Iraq and Nigeria provided supported. The Crude oil price trends, has caused lots of chaos as you can see the charts have been up and down since the middle of January with no conviction either side. In fact you could say both the bulls and bears are confused as to what is about to happen next.
Fundamentially, Pipeline outages in Iraq and Nigeria have removed more than 800,000 barrels of crude oil per day from the market for at least the next two weeks. The disruptions should offset recent increases to supply from Iran, analysts said.
Also on Friday, oilfield services firm Baker Hughes reported the total number of rigs drilling for crude in the United States fell by 13 to a total of 400 in the previous week. At this time last year, there were 986 rigs in U.S. fields.
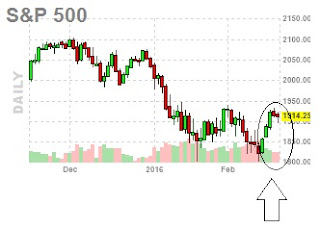
U.S. stock prices hit their highest in nearly two months after an upward revision to the country's economic growth for the fourth quarter. A raft of other U.S. economic data also boosted Wall Street, which has traded in tandem with oil for weeks.
"Equities have been in a rally mode and with the technical picture for oil becoming bullish in the short term, we have a risk-on trade in crude,"
Some analysts and traders were pricing oil higher in the near-term.
The chart above looks to be in serious trouble still. It seems every man and his dogs starts to call a bottom in OIL, as so as we start to see 1 or 2 green days. In our opinion calling a bottom in CRUDE OIL here is not only dangerous but hazardous to one's account. Right now there really is no reason to get all excited, because the chart drawn for you simply shows that crude has been in a vicious downtrend for months now, and over the past few weeks, a range has been formed, without any convictions. Its time to play things safely until either the upside or underside of this range is broken.
Right now the CRUDE chart is in no where mans land. If the price does infact go and break the 38 level, then the bulls will come out in droves and we are likely to go higher. But until that happens, we remain very very cautious here. It's a smart play just for now.
Our data and inventories falling last week for the first time since early November, suggesting that consumers could gobble up more of the world's oil products than expected. Its helping airlines and also consumers in the hip pocket. But it seems mainstream media is shying away from telling everybody. We are not sure why.
We think gasoline demand is actually rising suggests that perhaps the lower prices of crude are actually prompting a greater usage of this product (gasoline). Investment bank Jefferies called current prices unsustainable and said production declines across most of the important non-OPEC producers is likely to set the stage for an oil price recovery in the second half of this year.
The chart no doubt, is getting increasing sick, and its probably not hit rock bottom yet. As they say its always DARKEST before the DAWN, and looking at the chart above, its pretty obvious to us that maybe the DARKEST [a low in crude] has not been set just yet. Time will tell.
I cover more and more technical analysis ==> HERE in our VIP members section.
WHAT IF YOU KNEW WHICH WAY THE MARKET WAS ABOUT TO MOVE BEFORE IT HAPPENED? CLICK HERE To Join Our VIP ELITE GROUP -- FREE!
Powered by 123ContactForm | Report abuse


