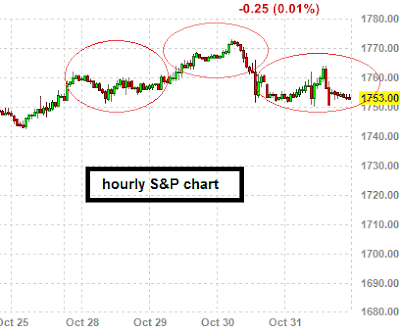
I woke up this morning, and turned my S&P 500 hourly charts, and I have to say the first thing that stuck out at me is the head and shoulder chart. Normally these sorts of patterns are seen as bearish. So I would expect that FRIDAY that some downside pressure is going to come to the markets!
Here is the hourly S&P 500 chart below.
 |
| SPX HOURLY CHART - Head and shoulders pattern |
WHAT IF YOU KNEW WHICH WAY THE MARKET WAS ABOUT TO MOVE BEFORE IT HAPPENED? CLICK HERE To Join Our VIP ELITE GROUP -- FREE!
Powered by 123ContactForm | Report abuse

No comments:
Post a Comment