Web Statistics August 2013

Saturday, 31 August 2013

spx weekly update - syria tension

Well it was a very interesting week this week, with the end of the month shenanigans playing out perfectly, and much tension building over in Syria as Obama lost support from his major allies, and is still contemplating whether or not to launch an attack to punish the Syria regime for using chemical weapons on its civilians.


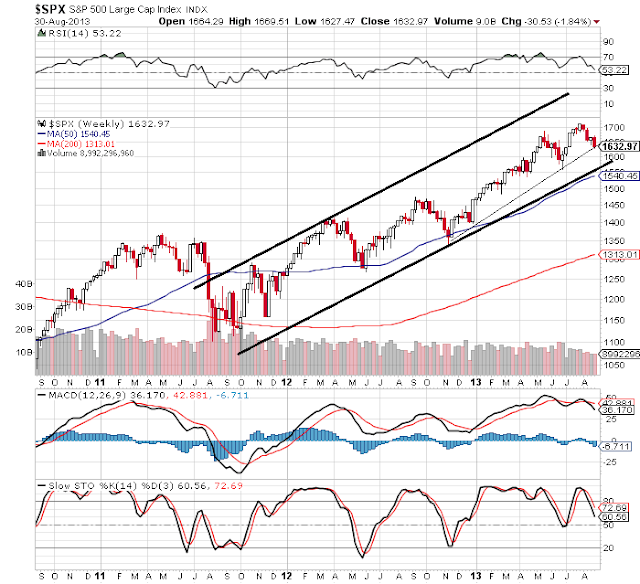
Last week we did warn our readers that the weekly chart was not looking healthy at all. We closed out this week at 1632, and as you can see, that this week the bears continued to do damage to the market, and this is normal into a 3 day long weekend coming. Market reversals played out quite nicely and the tensions in Syria helped the bear case also.

Divergence in the MACD histogram, and also the fact that the smart money will be back in SEPT is leading us to think this market might not be done on the downside quite just yet. But this is just a guess. We go more into detail in our VIP MEMBERS SECTION HERE, about what could happen in the next 4 weeks.

Due to the labor day long weekend, things will not get busy till Wednesday, so we will be updating our VIP members only, and will not be back till WED - THURSDAY next week.

Happy trading.

spx weekly update
SPX weekly update


WHAT IF YOU KNEW WHICH WAY THE MARKET WAS ABOUT TO MOVE BEFORE IT HAPPENED?  CLICK HERE To Join Our VIP ELITE GROUP  -- FREE!


Powered by 123ContactForm | Report abuse

Friday, 30 August 2013

NYMO chart

NYMO chart

The NYMO chart is not lying at the moment, meaning there could be some upside on the market coming, but the bears could do some damage next month, even some real serious damage looking at this chart. I guess we shall soon see.


NYMO chart
NYMO chart


WHAT IF YOU KNEW WHICH WAY THE MARKET WAS ABOUT TO MOVE BEFORE IT HAPPENED?  CLICK HERE To Join Our VIP ELITE GROUP  -- FREE!


Powered by 123ContactForm | Report abuse

Thursday, 29 August 2013

crude technical analysis

crude technical analysis

Lets take a moment to do a little crude technical analysis


crude technical analysis


As you can see the CRUDE CHART below is showing a breakout of a pennant on a pole. Also we talked about many things happening in SYRIA with the crisis there in the middle east, there seems to be some full blown panic buying as investors are getting scared that this crisis will soon spread into IRAN, IRAQ and other neighboring countries. A break of this pennant pattern below on the weekly charts is BULLISH!


crude technical analysis


WHAT IF YOU KNEW WHICH WAY THE MARKET WAS ABOUT TO MOVE BEFORE IT HAPPENED?  CLICK HERE To Join Our VIP ELITE GROUP  -- FREE!


Powered by 123ContactForm | Report abuse

Wednesday, 28 August 2013

Bearish flag showing

I was awake at 3am this morning and witness some pretty heavy sell stops going off one after the other today, and it seems that they were not finished today, and we are most likely to see more of the same either today or possibly later in the week.

Also we have broken out of a bearish flag on the DAILY SPX CHART so the bears are still winning here, and giving alot of weight to the market right now! OUCH!

bearish flag on SPX chart


WHAT IF YOU KNEW WHICH WAY THE MARKET WAS ABOUT TO MOVE BEFORE IT HAPPENED?  CLICK HERE To Join Our VIP ELITE GROUP  -- FREE!


Powered by 123ContactForm | Report abuse

Monday, 26 August 2013

Taper Talks

Taper Talks

Benny Boy - Hey Presto!


Looking at data here over the weekend, and I am starting to believe all this talk of tapering is just hyped up gibberish. They are due to give some sort of announcement on the 17th & 18th Of September.

Yes! Ok, I do believe that some day, they are going to have to stop printing money out of thin and throwing that in the market. However all these talks about tapering really is just that....all talk and NO ACTION! fancy that! :P :P

So you can put me in the camp where I believe no tapering is coming in SEPTEMBER and the reason is that there are too many concerns out there at the moment. And I am of the belief it will be a more drawn out event over many months, possibly even longer as there are too many economic concerns out there especially at the moment.

Right now with the market dropping it is self evident to me that the MARKET is PRICING or FACTORING in Tapering or wants to relieve some pressure. This is another reason why tapering will be a very lengthy long drawn out conclusion.

You have to remember we have seen quite a move in bonds lately which are going down, and futures markets are going higher.

Bonds Chart
Bonds Chart

A lot of the smart traders out there are thinking about the bigger picture and the about the bigger issues that are about to be tackled. The economy right now is far too volatile for the fed to say its safe to start TAPERING I believe.

Just my 0.02 cents.

WHAT IF YOU KNEW WHICH WAY THE MARKET WAS ABOUT TO MOVE BEFORE IT HAPPENED?  CLICK HERE To Join Our VIP ELITE GROUP  -- FREE!


Powered by 123ContactForm | Report abuse

Sunday, 25 August 2013

Bullish Flag On Silver

Bullish Flag On Silver

There seems to be a Bullish Flag On Silver that has broken out as you can see on the chart below. That would hint higher prices are coming soon.

bullish flag
bullish flag


WHAT IF YOU KNEW WHICH WAY THE MARKET WAS ABOUT TO MOVE BEFORE IT HAPPENED?  CLICK HERE To Join Our VIP ELITE GROUP  -- FREE!


Powered by 123ContactForm | Report abuse

Saturday, 24 August 2013

Flash Freeze Bullshit

Flash Freeze Bullshit

TODAY THIS IS A WARNING TO YOU!  

Nasdaq officials say a "connectivity" problem was what shut down trading for three hours this Thursday, but some cybersecurity experts are concerned that hackers may see an opportunity to attack the markets.

"This draws attention to a system that we know," said Alex McGeorge, a senior security researcher at Immunity Inc. "Even if this wasn't a malicious attack, this has some redundancy issues—meaning it is probably ripe for having some other types of security vulnerabilities."

I CALL BULLSHIT ON THIS...... HERE IS WHY!

Now I am not an expert on computers, I never have been and probably never will be, however over the years what I spend alot of my time doing is spotting trends, patterns and overall consistencies in the market that tend to REPEAT themselves both on the market and off the market also.

On this occasion I could not help myself but look over some of the notes I had right before the 2008 crash. Yes back in around 2006 - 2007 I remember I wrote down how secure they were saying the local markets and new upgrades to software and local electrical tickers meant there was more security and less chance of breakdowns and exposure to hackers who could exploit bugs and manipulate any part of the system. I remember a few weeks later after this news was released the market had to shut down for a day or so due to technical glitches.

Even here in 2013, in a time where computers are suppose to be extremely advanced we still had the NASDAQ market close down a few hours due to technical glitches. Is this amazing? no? Shocking...... definitely not! but I do see these same patterns forming before we had major problems on the market!

I remember there being major glitches, followed by extremely bad problems in the housing and sub prime markets, and then the market soon topped out, and we experienced a major crash in 2008 that wiped out many traders, funds, institutes, 401k's pension funds and all the rest. It was a horrific event!!! But here is the scary and strange coincidence about the 2008 crash and what is happening right now in 2013.

THE SCARY ELEMENT HERE - HISTORY REPEATS

The scary thing for me right now is that history seems to be playing out pretty nicely and not a soul is out there seeing this secret little world that I call "deconstructing history". I think there is a warning sign in it for us all. So I will try my best to explain how I think history is repeating.

We are having the slight signals the market is experiencing technical glitches the same as what we had back in 2006. My guess is that they were setting up a market crash years in advance and they needed some sort of scapegoat to blame incase their controlled sell off did not work, or did work. Soon after the sub prime markets imploded the market topped and we crashed at the end of 2008 and even into 2009.

Fast forward to today, and now we have all these computer glitch problems, and again I think they are getting warmed up for another controlled sell off or crash type scenario on the market, and again they need a back up or something that they can use as a scapegoat!

Here is where things really get interesting....

If they are planning another controlled sell off, and I said IF, you have to remember we are seeing a massive QE or stimulus program where the government has been throwing money out of thin air back into the market to help keep it propped up. Again this is similar to the massive property boom, and subprime boosting that lifted the markets back in the mid 2000's. Back then, this was a ridiculous situation where almost anyone could get a low doc loan and buy a house. Eventually that was doomed from day one, and when the subprime markets imploded the markets did too, badly. I mean people have still not recovered financially from that one.

Right now the markets are at all time highs, the government are now thinking about tapering back all this QE money out of thin air they keep printing and throwing on the market. Again this Quantitative Easing Program was doomed from day one, just like the subprime was doomed the very first day it was bought in. Stay with me here.......

There is a bullishness in the air amongst traders too. Yesterday I visited a forum in which traders are getting almost cocky that the stock market will never come down again. I chuckled to myself because I have been watching the markets over half my life and realize that about every 7 years the market experiences very bad sell off's and even crashes if you want to call it that. Over the last 20 - 30 years it has been working like clockwork. It is a cycle I have noted and its freakish how often this occurs. That cycle comes to an end next year in 2014. OH DEAR! Do you now see how all this is starting to add up.

So with the computer glitches, all these rumors of QE tapering, and the market booming to fresh new highs, is all setting up like the pattern in 2006 - 2007 where the market topped out and we crashed the year after. I am not saying to panic just yet, because these signs are a leading suggestion that something is definitely in the works. Now I could be wrong, but this is something I thought of today and wanted to post just because I thought the time was right! And because my readers have been asking for a fresh new longer term view of what the market will do in the next few years.

 I hate to bust peoples bubble, but right now if history keeps repeating we are looking at a MAJOR market event coming in the next few years. It is silly to put a date on it, because it will not happen tomorrow, but in the next few years looking at how things are repeating something BIG is coming. An event, similar to the 2008 crash, and an event that not many people were ready for.  I think the big events to watch are an implosion in the derivatives markets, which I think is very near, and also massive tapering by the FED. Once they start taking away massive amounts of MONTHLY stimulus, the market is not only in trouble, its going to cause what I say A PURE "SHIT STORM" THAT WE HAVE NOT SEEN BEFORE!  Sorry if the colorful language offends anyone, but this is the best way I can describe it, and the best way I can explain how history is repeating and to warn others out there.

Please pass this article onto others and warn them!. They might be the ones to thank you for it later.


WHAT IF YOU KNEW WHICH WAY THE MARKET WAS ABOUT TO MOVE BEFORE IT HAPPENED?  CLICK HERE To Join Our VIP ELITE GROUP  -- FREE!


Powered by 123ContactForm | Report abuse

Friday, 23 August 2013

Dow Weekly Update

Dow Weekly Update

The last few weeks on the market have been interesting, with a sell signal on the weekly chart, the bears have come back with a real biting attitude and they want to teach the bulls a lesson. The main concern for me is that we have broken a longer term rising support line (and channel) and this week we closed below it. That is a real thorn in the side for the bulls, however when you zoom back to 2010 just like we have on the chart below you can see this is still a bull market, and we have had sell offs along the way, however they only last a few weeks. So we could be in this process of back and filling again! :-)

Right now we have had 3 red weeks on the candlestick chart below and we are in a  TREAD CAREFULLY stance on the market. A close below this rising support line is not good, however it seems there could be lower prices coming sometime in SEPTEMBER 2013 and that might make sense as every man and his dog is awaiting the federal reserve Tapering news to see if they are going to start withdrawing the billions of dollars they are flooding the market with. My own personal opinion is it will not really matter if the tapering is a small percentage, investors will probably just get on with it and realize it is not the end of the world....however, we expect there to be a little bit of nervousness leading up to this FED Announcement which will occur on the 17th & 18th of SEPTEMBER.... I like the analogy that some analysts out there are calling it SEPT-APER! Very clever, but I must confess not matter what announcement may come, the charts always come first.

Right now the charts below are hinting at lower prices, but even if that does occur in the next few  months, I would not go falling in love with the downside, that is for sure. The bears do have chance to do some damage here or in the next few weeks, but how much we will have to wait and see!?

Dow Weekly Update
Dow Weekly Update


WHAT IF YOU KNEW WHICH WAY THE MARKET WAS ABOUT TO MOVE BEFORE IT HAPPENED?  CLICK HERE To Join Our VIP ELITE GROUP  -- FREE!


Powered by 123ContactForm | Report abuse

Thursday, 22 August 2013

NASDAQ disaster - MUST WATCH

NASDAQ disaster - MUST WATCH

They had to shut down the NASDAQ today, and this was not something that usually happens, and I think something is a bit fishy, but I let Danny From Mr Topstep (who is live on the CME market floor) talk more about why this happened.

CLICK PLAY BELOW TO WATCH!


WHAT IF YOU KNEW WHICH WAY THE MARKET WAS ABOUT TO MOVE BEFORE IT HAPPENED?  CLICK HERE To Join Our VIP ELITE GROUP  -- FREE!


Powered by 123ContactForm | Report abuse

Wednesday, 21 August 2013

psychology of investing

psychology of investing

When I first started trading, I remember there was a person I use to look up to, or one of my mentors as you would call it, and he told me to be a good trader you have to something think the total opposite of all the other traders other there.

This chart is the purest form of the psychology of investing

The psychology of investing chart below is basically showing you the phases of a trader and how they trade a typical trend. I am sure many of our readers understands this process and the psychology behind how a trader thinks, act and behaves! Quite amusing to say the least!


psychology of investing

psychology of investing


WHAT IF YOU KNEW WHICH WAY THE MARKET WAS ABOUT TO MOVE BEFORE IT HAPPENED?  CLICK HERE To Join Our VIP ELITE GROUP  -- FREE!


Powered by 123ContactForm | Report abuse

Russell Daily Chart

Russell Daily Chart

The Russell Daily Chart is showing a clear bearish flag here, so some more selling  may be on the cards.


WHAT IF YOU KNEW WHICH WAY THE MARKET WAS ABOUT TO MOVE BEFORE IT HAPPENED?  CLICK HERE To Join Our VIP ELITE GROUP  -- FREE!


Powered by 123ContactForm | Report abuse

Jackon hole meeting

get ready for the Jackon hole meeting where minutes of the fed meeting will be released.

I always think a picture speaks a thousands words for Ben Bernanke and his troops, and here is that picture. HAHA.


WHAT IF YOU KNEW WHICH WAY THE MARKET WAS ABOUT TO MOVE BEFORE IT HAPPENED?  CLICK HERE To Join Our VIP ELITE GROUP  -- FREE!


Powered by 123ContactForm | Report abuse

Tuesday, 20 August 2013

Is The Market Really Crashing

Is The Market Really Crashing ?

Having a look around the blogosphere this morning I was quite alarmed at what I was reading. There seems to be some so called analysts and news media sites calling the sell off we have been witness too the start of a bigger crash and or meltdown on the market.

WOW! I think these are big statements but would like to take the time to help traders young and old as to what I think ('IN MY HUMBLE OPINION' - of course) is really going on right now in a few simple sentences.

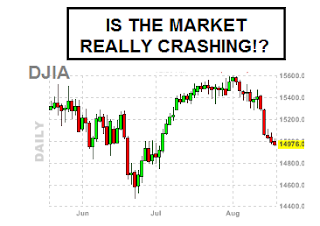
Before I do that, it is important to show you a chart, so lets go to the most damaged indicie chart right now the DOW JONES DAILY CHART.....

Is The Market Really Crashing


As you can see on the chart above we have gone from 15500 all the way to the 14976 level. So in saying that we have sold off just over 500 points as you read this. No where near a crash, that is for sure.

In fact, in terms of the huge move up we saw back in JUNE - AUGUST we have only taken off about half of those profits so far. So again, it is nothing really to sneeze at.

Here are some other important NOTES to REMEMBER :-

* We have rallied quite extensively in 2013 and profit taking is always going to occur.

* We are currently in a BULL MARKET and no where does it state bull markets must go UP IN A STRAIGHT LINE. 

* There has been no let-up in the 'taper tantrum' that has demolished stocks across the emerging markets in recent months.

* The fed has not issued their TAPERING statement this will happen NEXT MONTH.

* Spiking interest rates is putting pressure on the overall market.

* This is AUGUST and notoriously known to be low volume, and prone for corrections over the decades as smart money and bigger traders are on holiday, and totally out of the market.


WHAT IF YOU KNEW WHICH WAY THE MARKET WAS ABOUT TO MOVE BEFORE IT HAPPENED?  CLICK HERE To Join Our VIP ELITE GROUP  -- FREE!


Powered by 123ContactForm | Report abuse

Dow Jones Daily Chart update

Dow Jones Daily Chart update

It seems many investors are nervous right now, and the Dow Jones Daily Chart in the last few days has technically breached a significant RISING SUPPORT line that has been in place since the start of JANUARY 2013. (see below)

We have actually seen 4 consecutive days of selling on the market now, something we have not seen for several months.


Dow Jones Daily Chart update


WHAT IF YOU KNEW WHICH WAY THE MARKET WAS ABOUT TO MOVE BEFORE IT HAPPENED?  CLICK HERE To Join Our VIP ELITE GROUP  -- FREE!


Powered by 123ContactForm | Report abuse

Monday, 19 August 2013

nyse margin debt - nyse margin debt startling chart

nyse margin debt

I saw a very startling chart today. It was a chart of the latest nyse margin debt as you can see below.

 Margin debt is again hovering around extreme levels, according to GaveKavel Research’s Charles Gave. He reminisced about an old boss who once told him, “Charles, you will never get rich in this business using other people’s money. Do NOT leverage your positions. The nyse margin debt chart puts those on the market leveraging into a more formal and accurate picture.

Leverage might be all right for fellows who deal in real estate, but for those in stock markets, it only brings misery.” Gave ignored at first, but then suffered a few margin calls. Now, he’s on board, and says that those prone to using borrowed money “seem to get most enthusiastic just before a recession, usually after a prolonged out performance of equities against bonds.” Hard to argue with him from the looks of this nyse margin debt chart below.

nyse margin debt
nyse margin debt


nyse margin debt

WHAT IF YOU KNEW WHICH WAY THE MARKET WAS ABOUT TO MOVE BEFORE IT HAPPENED?  CLICK HERE To Join Our VIP ELITE GROUP  -- FREE!


Powered by 123ContactForm | Report abuse

Sunday, 18 August 2013

Bernanke might postpone tapering

Bernanke might postpone tapering ?

The Bernank may delay his plan to taper bond purchases past September, as investors expect, because I have noticed a surge in interest rates this week. It is something Bernanke is watching, and will react too.

Alot of traders I believe are not reading the signs right. Many analysts are saying tapering is coming, however you have to remember that simply nothing at all is currently being done, and all this market movement is due to one thing - RUMORS, RUMORS and more RUMORS.

 Ok, I will be the first to admit, rumors are always going to move the market any day of the week. However this is a big one as we are talking about a massive stimulus program that has been going on for year now. I doubt the economy is good enough for the rumors to be bought off the table and for tapering to come in quickly. Infact, I would say that looking at the dow jones chart below, the market is already pricing in tapering if indeed it does happen or even if it doesn't.


Bernanke might postpone tapering


I think that this selling off will also slow down the amount of tapering that COULD occur and I underline that word COULD! Right now it seems every time Bernanke sits down at capitol hill, he is just blowing steam up everyone's arse. He keeps hinting that he will take action, but my interpretation on that is that things are not good enough for him to even take the most minute of action.

I don't think that Bernanke is going to be held hostage to the bond market, and the fed right now knows that rumors can really get this market moving, so imagine if they actually had to do something.

The Fed has been buying $85 billion in treasuries and mortgage-backed securities each month in an effort to reduce interest rates. This is all part of the central bank's quantitative easing, or QE3, plan. Stock and bond market investors expect the Fed chief to slow this process as early as September but we might not see anything until the new year. Its all talk and BS in my opinion.

But again, these dates and all this BS from the Fed is just making me think there is something much bigger going on here. I mean, nothing has actually been done, and the economy is not doing that well. Or well enough for them to start taking action. This is a repeating pattern, like a cycle that is getting traders on the wrong side of the trade! But most of the big boys love it when you are on the wrong side of the trade, it means it makes their job alot easier.


WHAT IF YOU KNEW WHICH WAY THE MARKET WAS ABOUT TO MOVE BEFORE IT HAPPENED?  CLICK HERE To Join Our VIP ELITE GROUP  -- FREE!


Powered by 123ContactForm | Report abuse

Friday, 16 August 2013

Weekly Dow Chart

Weekly Dow Chart

The Weekly Dow Chart is not looking particularly healthy. There is divergences in the RSI indicator on top, and also the weekly stochastics as well.

Right now there are not many bigger traders in the market, but for the participants that are trading, they seem to be worried about the fed and their tapering decisions on the market soon. That does not occur until the 17th & the 18th of September, however you can see by the selling off over the last two weeks, that this is worrying many out there.

I have many guesses as to what might happen, bullish and bearish, but it does not matter, while other people out there struggle by trading the news, our members basically sit down and learn how to read charts and forget all the noise out there. :-)

Showing our readers this chart is super important because right now on the weekly you can see that we are in a bullish market. That is when the chart you are looking at is going from the bottom left to the top right. In our eyes this is not a bearish market. You do have to remember that even in BULLISH markets there are periods of selling or profit taking at regular intervals.

For us we are waiting for the smart money to get back in the market. These low volume moves in AUGUST will soon pass.

Weekly Dow Chart
Weekly Dow Chart


WHAT IF YOU KNEW WHICH WAY THE MARKET WAS ABOUT TO MOVE BEFORE IT HAPPENED?  CLICK HERE To Join Our VIP ELITE GROUP  -- FREE!


Powered by 123ContactForm | Report abuse

Weekly Vix Chart

Weekly Vix Chart

The Weekly Vix Chart has clearly shown a lot of support down at the bottom of the 11 region and has not broken below there.  We are currently at 14.3 on the vix as of close on friday and there is a higher probability we rally higher in the coming weeks.  17 - 18 is a good target we think.

Weekly Vix Chart
Weekly Vix Chart


WHAT IF YOU KNEW WHICH WAY THE MARKET WAS ABOUT TO MOVE BEFORE IT HAPPENED?  CLICK HERE To Join Our VIP ELITE GROUP  -- FREE!


Powered by 123ContactForm | Report abuse

Thursday, 15 August 2013

Sentiment Trader Spot on Again

Sentiment Trader Spot on Again!

Yes! First of all I urge you to go and read this post here.

=> SOUND THE ALARMS!  Posted a few weeks ago. We warned the market could be topping out.

Here is a chart of the post back then, The S&P 500 daily chart.

crowd is getting OVERLY BULLISH

Our Quote  :

1) EVERYONE IS STARTING TO GET UBER BULLISH, AND THINKS THE MARKET WILL NEVER COME DOWN AGAIN!

2) THOSE THAT LOST MONEY IN THE 2008 ARE NOW GETTING THEIR CONFIDENCE BACK AND THINKING ABOUT PUTTING ALL THEIR MONEY BACK IN THE GLOBAL MARKETS BECAUSE THEY DONT WANT TO MISS A BIGGER RALLY COMING?

3) A LOT OF TRADERS & NEWS KEEPS GETTING MORE BULLISH BY THE DAY


============================

 We did warn and spotted patterns, that many people were overlooking. 

Today 16th of August 2013 Have a look at the chart of the DOW today, we crashed down pretty hard. This chart is looking unhealthy to say the least. 


You have to love Technical Analysis and congrats TO OUR VIP MEMBERS HERE that did really well.


WHAT IF YOU KNEW WHICH WAY THE MARKET WAS ABOUT TO MOVE BEFORE IT HAPPENED?  CLICK HERE To Join Our VIP ELITE GROUP  -- FREE!


Powered by 123ContactForm | Report abuse

Nikkei Chart anlaysis

Nikkei Chart anlaysis

Today in the VIP room HERE we were discussing the NIKKEI daily chart.

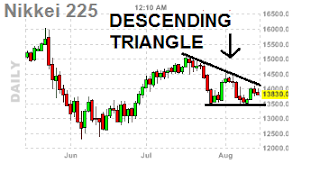
The nikkei has not really being doing much after a large drop, however right now it seems to be in a bearish descending triangle pattern.

As you can see the buyers are slowly day by day getting squeezed by the sellers. The next few days shall be important for the nikkei, and the bulls need to do something, otherwise they could be overpowered by the bears.


descending triangle - nikkei chart


WHAT IF YOU KNEW WHICH WAY THE MARKET WAS ABOUT TO MOVE BEFORE IT HAPPENED?  CLICK HERE To Join Our VIP ELITE GROUP  -- FREE!


Powered by 123ContactForm | Report abuse

Wednesday, 14 August 2013

nymo shows the way

The NYMO chart below is telling us the market is taking a break right now, and does not look healthy at all. Its currently at -43.


WHAT IF YOU KNEW WHICH WAY THE MARKET WAS ABOUT TO MOVE BEFORE IT HAPPENED?  CLICK HERE To Join Our VIP ELITE GROUP  -- FREE!


Powered by 123ContactForm | Report abuse

Tuesday, 13 August 2013

Should You Fight The Fed

Should You Fight The Fed ?

There is a saying that a picture speaks a thousand words. As a chartist I can tell you that there is nothing more that is further than the truth.

I get about 10 emails a week, and since 2010 many bears laughed at my bullish charts, and told me I was crazy if I think the market was going higher!  I told them at the time, to put down the crack pipe and have a look at what the fed was doing.

Below is an updated chart virtually perfect correlation between Fed asset purchases and what the stock market has been doing. It is a perfect graphic representation of what you SHOULD NOT fight the fed.

As you can see the massive QE purchases has done 2 things.

1) Sent the market skidding up higher.

2) Hurt the bears who were top calling every few months.  

Should You Fight The Fed


WHAT IF YOU KNEW WHICH WAY THE MARKET WAS ABOUT TO MOVE BEFORE IT HAPPENED?  CLICK HERE To Join Our VIP ELITE GROUP  -- FREE!


Powered by 123ContactForm | Report abuse