ACCESS OUT FULL PREMIUM ELITE VIP NEWSLETTERS & UPDATES!
See What The Fuss Is About - Try Us Free For 14 Days! - Limited Time Offer - Hurry!
Get access to our Daily analysis, videos, coaching, audio, charts and indicators AND MORE....=====================================================
freeport-mcmoran copper & gold - freeport macmoran chart ?
 |
| freeport macmoran chart |
freeport-mcmoran copper & gold - freeport macmoran chart
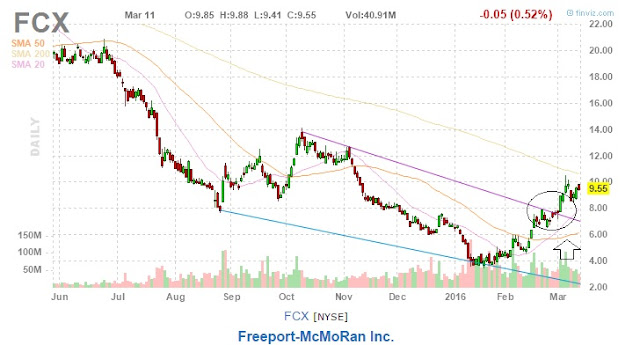
freeport-mcmoran copper & gold - freeport macmoran chart is an intersting look right now. You can see the daily chart above!
We have been watching this chart for months, because, when you look around its definitely one of the most hated stocks on Wall Street is surging this year.
Freeport-McMoRan is among the top stocks in the S&P 500 Index with the highest short interest on the street, yet shares are up more than 40 percent in 2016. That makes it the fourth-best performing stock in the large-cap index.
There has been dramatic and recent turnarounds in oil and copper, which have rallied 50 percent and 16 percent from their respective 52-week lows. Despite being despised by many, Freeport's commodity-driven stock has recently caught our eye because some of the technical are screaming out at us, and it could be hinting and winking about what is on the cards for later this year.
We doubt this game with the Fed will continue! Its not really going to last, this monetary divergence relative to the Central Banks, If the Fed has no choice does not remain accommodative all hell will break loose!!!. That's could put pressure on the dollar and put the commodities space in play to upside. So far its looking good, but things will need to hold if it wants to keep its conviction.
According to Gordon, Freeport-McMoRan could be one of the main beneficiaries from this upturn, and the stock could be on the verge of an even bigger breakout when you look at the chart above and calculate some of the technicals.
The downtrend for Freeport has been broken, and we are clearly moving to the upside, and if crude has bottomed here, the only way is UP, if we were to look forward into SEPT and OCT later this year.
We could witness the $14 region, if things continue along the projected path.
freeport-mcmoran has busted out of its downtrend, and you can see that its not just prying its head above, its a convincing break out. The next target would be back at the 14 dollar highs. If we see that play out, then you could really see the buying start to accelerate as investors start to see this as being one of those undervalued stocks, and everyone will want to jump on the bandwagon, by then, it might be too late, so that is why we are bringing it to the attention of our readers right now. A nice chart, with the technicals just getting better and better. Some caution is needed, but this chart should be on your watchlist for the remainder of 2016.
I cover more and more technical analysis ==> HERE in our VIP members section.
WHAT IF YOU KNEW WHICH WAY THE MARKET WAS ABOUT TO MOVE BEFORE IT HAPPENED? CLICK HERE To Join Our VIP ELITE GROUP -- FREE!
Powered by 123ContactForm | Report abuse


No comments:
Post a Comment