Web Statistics December 2015

Monday, 28 December 2015

s&p 500 predictions - 2016 s&p 500 predictions


ACCESS OUT FULL PREMIUM ELITE VIP NEWSLETTERS & UPDATES!


 FREE 14 DAY TRIAL - CLICK HERE

See What The Fuss Is About - Try Us Free For 14 Days! - Limited Time Offer - Hurry!
Get access to our Daily analysis, videos, coaching, audio, charts and indicators AND MORE....


=====================================================

s&p 500 predictions - 2016 s&p 500 predictions

What We See?


Well its that time of year again!

source :  marketwatch

Yes! With santa out of the way, Wall Street stocks still looking a bit flat as the market closes out 2015. Crude oil CLG6, -3.36% is back to its downbeat ways, relinquishing most of the sizable gains the commodity scored last week. With crude down so much, the market is really feeling the pinch!

Stocks are under pressure. The S&P 500 index SPX, -0.37% which had been clinging to a meager annual gain as recently as Christmas Eve is looking at a 0.6% decline year to date, joining the Dow Jones Industrial Average DJIA, -0.25% down 2.1% year to date, in negative territory.

There are many equity strategists out there who are holding on to optimism for 2016, even as the stocks look set to limp out of the 2015.

Our view is oil is going to stabilize at a low level, and we will see some of the consumer dividend get spent next year, but there are some hurdles to get through as we go into 2016. We just cannot jump on the bandwith of all the BEARS out there. For us, doing that does not make sense.


Generally speaking, U.S. strategists aren’t particularly sanguine about the prospects for 2016, with many polled by MarketWatch offering 2016 forecasts that are lower than their 2015 predictions, as we head into the new year.

It is important to point out that there were a few of our predictions in 2015 that haven’t exactly panned out the way we anticipated. But we did accurately predict a bumpy ride in 2015, and even though no one can really see the future with the market, as anything can happen, we think that its a fair call that more volatility is going to occur next year.

In 2015, a stronger dollar, which gained more than 8% this year, as measured by the ICE U.S. Dollar Index DXY, +0.04% has limited profits for big U.S. companies. Plunging oil has raised fears about the earnings power of energy companies and stoked concern about problems in high-yield bonds HYG, -0.56% spilling over into the broader market.

With a rising US dollar,  corporate earnings will be key to the market’s success in 2016. But it is hard to see the dollar’s strength abating in the face of expectations that the Federal Reserve will continue to normalize interest rates next year, and calling the bottom of oil’s stunning price collapse has been a losing effort so far

s&p 500 predictions - 2016 s&p 500 predictions

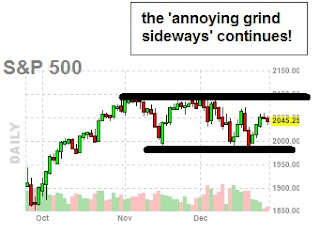
Bulls and bears are locked in a year-end tug-of-war, as the chart below shows. We can tell you that the end of year has a bias to the upside, and so far that has been playing true, however as you can see on the daily S&P chart below, we have been in nothing more than a sideways market. Its pretty much pissing off the bulls and the bears out there.

s&p 500 predictions
s&p 500 predictions


Contrarians currently are neutral about the stock market’s near-term direction, since the current Wall Street consensus is neither excessively bullish nor excessively bearish.

This will come as good news if you were worried that there might still be too much bullishness out there that needs to be worked off. But this news will be discouraging if you were hoping that the market’s recent declines were enough to completely rebuild the Wall of Worry that rallies like to climb.

Consider the average recommended equity exposure among a subset of short-term stock market timers monitored by the Hulbert Financial Digest (as measured by the Hulbert Stock Newsletter Sentiment Index, or HSNSI). This average currently stands at 31.4%, less than half the 65.7% reading registered in the first week of December. But some of the big hedge funds that follow this has gone broke this year. This is not a market where you buy and hold anymore, that does not work.


The speed and extent of this drop is encouraging, since it suggests that there is not the kind of stubbornly held bullishness that often accompanies major market tops. A textbook illustration of that kind of bullishness came at the top of the Internet bubble in March 2000, when — in the wake of the first 10% correction off the market’s all-time highs — the average market timer became even more bullish.


Barron's Senior Editor Jack Hough previews the latest issue of Barron's, which includes the value of investing in money managers, the advertising sector outlook for 2016, and the attractiveness of some junk bonds. Photo: Getty

So it’s definitely good news that we’re not following that script from 15 years ago.

Why, then, aren’t contrarians more bullish now? The answer is implicit in the chart accompanying this column: Even though the HSNSI has fallen dramatically over the last two weeks, it still hasn’t hit the even-lower levels that have accompanied the most significant bottoms of the last couple of years.

You may find it frustrating that contrarian analysis doesn’t produce a clear and unambiguous forecast of either a higher or lower market. But it’s worth remembering that only rarely do good stock market indicators provide such “shout from the rooftops” signals. Most of the time they are in-between those extremes.

Now appears to be just such a time


 We are seeing some significant signs that 2016 can be a bullish year! I guess that is good news, however what you do not want to see is the BOTTOM fall out of the market in the next few weeks. If that was to happen, it would not represent a good situation at all. 

Next year we see rapid developments in technology too. That is good news and likely to hold up the market as well. We are now living in a world, where things are moving so fast, the next and broadcasters cannot keep up. Iphones, apps, drones, hoverboards are all hot topics and on everyone Christmas list. The world in which we live is speeding up, the market can smell it, and it loves the though that this TECHNOLOGY boom is just what the doctor prescribed. We are living on the edge of a boom not seen before. It reminds us to a similar situation back in the DOT com days, when things grew too fast for itself, and ended up on a DOT COM CRASH, but realistically you have to see massive euphoria first, and we can defiantly say we are no where there yet. We will get there, but its probably going to take years! For now we just bask in the sun and hope the market does not see a down-leg here at the end of 2015, if that was to happen, it would be nothing more than a warning shot across the bow.  But because the market held so well, in 2015 this could be one of those consolidation years, before we see another leg higher in the TECH BOOM, and the MARKET itself. Time will tell. :-)


 I cover more and more technical analysis ==> HERE in our VIP members section.


WHAT IF YOU KNEW WHICH WAY THE MARKET WAS ABOUT TO MOVE BEFORE IT HAPPENED?  CLICK HERE To Join Our VIP ELITE GROUP  -- FREE!


Powered by 123ContactForm | Report abuse

Sunday, 20 December 2015

stock market patterns - analysis chart


ACCESS OUT FULL PREMIUM ELITE VIP NEWSLETTERS & UPDATES!


 FREE 14 DAY TRIAL - CLICK HERE

See What The Fuss Is About - Try Us Free For 14 Days! - Limited Time Offer - Hurry!
Get access to our Daily analysis, videos, coaching, audio, charts and indicators AND MORE....


=====================================================

stock market patterns - analysis chart

SPX CHART!


So Was 2015 a year of consolidation, or worse, distribution ?

source :  marketwatch

Now that the Federal Reserve has finally raised interest rates, what can we look forward to for the remainder of 2015 and on into 2016? Will a year of "stuck in neutral" turn out to be a consolidation phase — a period where the market rests up before lurching higher — or will it instead eventually be seen as distribution, a period where the so called smart money ends up having sold the bulk of their inventory to the dumb money? The answer to that question means a great deal about what you or I might do in 2016 and the answer is intimately tied to how future economic data is likely to be viewed.

If we look back at 2016, the world economic data left a lot to be desired. With slowing growth rates in most of the world, the United States has been seen as the promised torch holder for the coming year. Unless the U.S. can continue to grow despite all the overseas headwinds, so the thinking goes, then the world is likely to face another global recession in the not-to-distant future.

By raising rates, the Fed has told us that the economy is able to start to stand on its own. They have also implicitly said that if it gets stronger then they will act to raise rates farther and that's what they expect to happen.

So, given this data, what conclusions can we draw? First, if data is a lot weaker than expected, then the Fed is going to be seen as not having a good handle on what is really happening. Fed credibility will suffer as a result, and that will not be good for the markets.

Secondly, if data starts to be of the barn-burner type, then the fears of more aggressive rate hikes are going to begin to litter the landscape. That, too, will not be market friendly.

The likely result of these two scenarios is so very different than what we have had for the past six years where all news was good news. If the economy was bad, no problem, the Fed has our back and they will keep push money out. If the economy was good, then that was great, too, since it meant that what the Fed was doing was working.

Contrast that with the scenario that is about to develop where the economic data points need to be not too hot and not too cold in order to exude confidence. A very different picture that holds a very different set of outcomes. That's the environment we are likely moving to.

With only a few weeks left in 2015, the stock market did recover well from the WORRIES over in CHINA mid year. You can see the market crashed 300 points rather fast, and then recovered the several weeks after. See the chart below marked V BOTTOM [below]


stock market patterns - "V" Pattern


As for the broader question of consolidation vs. distribution, note that the patterns typically look about the same when examining longer-term charts. Most technicians would say that dissipating volume during the sideways period is the signal that it is distribution vs. consolidation, but I'm not so sure that is true all the time.

Here's a current picture of the S&P 500 on a weekly time frame. There are two price points that appear reasonably critical to answering the distribution vs. consolidation question. If this is just consolidation, then the line in the sand is around 2103. That, on a weekly basis, is the breakdown bar and if you want to short this market or take off more inventory, then that is the price area where you want to do it.

You can see the the last few weeks, the market has been all over the place, and basically going sideways, but in technical analysis terms, this could be referenced or be similar to what is normally termed a BULL FLAG!? You can see it drawn on the chart below.


Although scaling that area and holding over it for a couple bars (two weeks) would not guarantee higher prices to come, it would certainly tilt the odds heavily into that camp. That would say this looks to be more like consolidation rather than distribution. As the chart clearly shows above.

The confirmation of distribution won't happen until the lower of the two range is broken. That is, of course, a long way down from the present price point.

If you consider other evidence you also get a mixed picture. Most of Asia is suffering through bear markets already. Commodities are in the midst of long and ingrained bear markets and even European markets — despite a huge currency depreciation — remain mired well below their highs from less than a year ago. All of this supports the notion that this is distribution.

Thus, the end result is a mixed picture and until further evidence is offered up, one has to remain cautiously bullish but with reduced exposure. That is what I have preached all year long and is what you should be doing. If you aren't, you really should reassess your stance. Let the markets drive your exposure levels — not what you think the market might do on any given day.


 Yes, we did warn that there could be some sort of santa rally!, but the Quadruple witching last week, really played havoc with the markets. You can see that even though we had troubles in CHINA, that stock market is still in a sideways pattern for the whole of 2015. Its throw many traders off, and all the rest probably are sitting on the sidelines not knowing what to do!

In the real world, its not really that easy to guess what the market is going to do next, however what we can say is that if you look back over the last 100 - 200 years of data on the S&P or the other indices charts, normally when you have a sideways year in a bull market, it basically means the market is gathering steam or slowly building up kinetic energy for a RALLY or UP year!. We are not saying next year 2016, is going to be an explosive RALLY YEAR from JAN to DECEMBER, however 2015 felt like a year we had before 2013, when double digit returns came to the market. So we could be in on of those situations again, time will tell. We will urge to keep you updates either way. There are lots of opportunities coming in new vehicles too next year in 2016, and the stock exchange itself has many changes.  


 I cover more and more technical analysis ==> HERE in our VIP members section.


WHAT IF YOU KNEW WHICH WAY THE MARKET WAS ABOUT TO MOVE BEFORE IT HAPPENED?  CLICK HERE To Join Our VIP ELITE GROUP  -- FREE!


Powered by 123ContactForm | Report abuse

Tuesday, 15 December 2015

federal reserve rate decision - federal reserve rate decision and the charts


ACCESS OUT FULL PREMIUM ELITE VIP NEWSLETTERS & UPDATES!


 FREE 14 DAY TRIAL - CLICK HERE

See What The Fuss Is About - Try Us Free For 14 Days! - Limited Time Offer - Hurry!
Get access to our Daily analysis, videos, coaching, audio, charts and indicators AND MORE....


=====================================================

federal reserve rate decision?


federal reserve rate decision -  2015 its time, and everyone is waiting with baited breadth. Raymond James strategist Jeffrey Saut said Tuesday stock investors should get ready for a "rip your face off-type rally."

"You've got massively oversold conditions in the equity markets, the firm's chief investment strategist told  "Squawk Box." He said stocks could reach new highs by year-end: "The setup is pretty good for a rally to the upside that's going to surprise a lot of people.

The recent negativity in the market does not deconstruct the bullish case here, Saut added. The sharp decline in junk bonds and oil prices on Friday led to a selloff of nearly 310 points in the Dow Jones industrial average. Stocks bounced higher Monday and in premarket trading Tuesday.

Here is a chart of the SPX, the question is, does this really look like a stock market crashing. Have a look at the chart below and be the judge yourself. You can see how the market is holding quite well, and not entering this CRASH or set up for a crash like many analysts are out there preaching. So far we are holding the lows in NOVEMBER 2015.


"[Stocks] are not as cheap as they were back on [August 21] when I actually said the market is going bottom today. But they are not all that expensive [either]," Saut said.

Saut said he made that summer swoon prediction based on a proprietary market timing model, which also signaled a top in late October. That also turned out to be correct within days. The S&P has fallen about 4 percent since then, as of Monday's close.

But he said Tuesday the model "is calling for a rip your face off rally right here."

Saut believes the stock market can weather an interest rate hike by the Federal Reserve on Wednesday at the conclusion of the central bank's two-day policy meeting.

Fed Chair Janet Yellen is a "gradualist," he said. "I think she does raise rates. I think she then steps back two, three, four or five months to see the impact on the economy, on the financial markets, [and] on the real estate market before she does another rate ratchet."

It’s a big day when it comes to one hot topic of market conversation right now.

Chris Weston, chief market strategist at IG explains: “The notion of a ‘Santa Claus’ rally needs to materialize in today’s U.S. trade. On average, over the last 30 years, the market hit a pivot low on 15 December, before averaging a gain of 1.9% into year-end. If this seasonal pattern is to eventuate, then today traditionally marks the start.”

Of course, on average on Dec. 15, the market wasn’t dealing with the start of a crucial two-day Fed meeting. And some analysts, like one featured in yesterday’s call, say tomorrow is when things could really turn ugly for this market. David Stendahl of Signal Trading Group also takes a look at seasonality on his blog. His chart gives December a mixed outlook:

But hey, Santa’s wish is this market’s command, right? Things are looking pretty festive for stock futures, for now. Oil is doing some lifting, for now. Weston thinks crude is a buy at the moment, and he says if the U.S. oil benchmark breaks above an area of $37.76 to $37.94, then it could climb back to $40 a barrel.

Meanwhile, the Noise! Noise! Noise! around high-yield bonds threatens to drown out the carolers. Several on Twitter yesterday noted how the topic had gone mainstream, even showing up on Gawker.com, where a few readers made high-school jokes about junk. In any case, the strategist behind our call of the day is nonplussed after seeing all of the scary headlines. He says at some point the hysteria is going to die down and opportunity will open up.

Key market gauges
Dow YMZ5, +1.54%  and S&P ESZ5, +1.61%  futures are making a nice run higher. Crude CLF6, +3.11%  was up a fair bit, but has pared some gains as the open nears. Moody’s has slashed its oil forecast for 2016 by 17%.

Gold GCF6, -0.12%  is little changed and the dollar DXY, +0.66% is mostly flat. In Asia ADOW, -0.74% the Nikkei NIK, -1.68%  had a bumpy session, but Chinese stocks SHCOMP, -0.29%  rose. Europe SXXP, +2.87%  is powering ahead.

The economy
The Fed meeting kicks off today. Our preview sees plenty of pitfalls ahead for the central bank, which is widely expected to lift rates. While you’re at it, here’s the reading level you need to decipher Fedspeak.

And don’t miss our exclusive interview with Ben Bernanke.

Data showed consumer prices were flat in November, though the core rate rose for a third month, and the Empire state index showed less contraction in December.

The buzz
Lumber Liquidators LL, +29.45%  is rocketing higher in premarket on news a famed short seller has backed off.

Unicorn down! The Hudson’s Bay Co., which owns Saks Fifth Avenue, is nearing a deal to buy online luxury retailer Gilt Group for around $250 million, says The Wall Street Journal.

Valeant VRX, +19.61%   shares are up in premarket after the company announced a 20-year agreement with Walgreens Boots Alliance WBA, +0.44% Under the deal, Valeant will offer Walgreens a discount on a range of products.

SiriusXM SIRI, +2.38%  has signed a 12-year deal with broadcaster Howard Stern.

F5 Networks FFIV, +3.41%  could see active trading after it said late Monday its CEO is departing over “matters regarding personal conduct,” and VeriFone PAY, -0.16% may gain after its quarterly results beat views late Monday.

The call
FMD Capital Management is ready to pounce on all of this junk-bond chaos. In a blog post, David Fabian, the fee-only advisory firm’s COO, says he’ll likely be a buyer of high-yield debt next year.

 Yes, we did warn that there could be some sort of santa rally!, Today was a nice day up on the SPX, as you can see on the chart below. Realistically, no one knows what comes next on the market, not even us. However our members have got lots of warning!, and it seems this hype in the fed lasts for days and weeks, and months leading up to the actual annoucement, and then when they have the FOMC DAY, all it does is fizzle out and you hear them scream "no no, we can't raise rates, the economy is too bad!" Its the same old thing, over and over again, like one of those record track on repeats. If I was to give you some SMART advice, is that here at the end of 2015, stop listening to people out there saying this market is DOOMED, and is about to crash, you hear it on all the blogs and all the analysts and to be honest the market is holding up very well!!!. The market is holding here well, and that could be a sign for things to come EARLY 2016. 


 I cover more and more technical analysis ==> HERE in our VIP members section.


WHAT IF YOU KNEW WHICH WAY THE MARKET WAS ABOUT TO MOVE BEFORE IT HAPPENED?  CLICK HERE To Join Our VIP ELITE GROUP  -- FREE!


Powered by 123ContactForm | Report abuse

Sunday, 6 December 2015

january effect stock market

january effect stock market

are we in a bear market
ACCESS OUT FULL PREMIUM ELITE VIP NEWSLETTERS & UPDATES!


 FREE 14 DAY TRIAL - CLICK HERE

See What The Fuss Is About - Try Us Free For 14 Days! - Limited Time Offer - Hurry!
Get access to our Daily analysis, videos, coaching, audio, charts and indicators AND MORE....


=====================================================

january effect stock market ?


january effect stock market

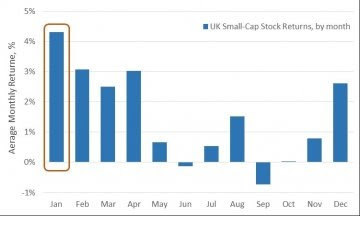
The January Effect offers an opportunity to potentially make about 30% in three months. It is a phenomenon that makes prices of certain stocks rise more in January than the market averages. It does not always occur, and nothing is actually set in stone, but its a very very interesting statistic, that is well worth a mention here.

Over the last 30 years, we have made money from the january effect stock market about 75% of the time, broken even about 10% of the time, and lost money about 15% of the time. Odds favor that the january effect stock market will be profitable this year.

The stock market is dynamic and as such at The Arora Report these zones are reviewed daily and revised as appropriate. One chart is shown below.

Under one potential scenario, the stock dips and there is a fill at $2.00 in December. In January the stock bounces strong and the average exit is at $8.00.In this scenario, the return will be 300% in about a month or 3600% annualized.

Here is a CHART that shows the strongest market months going back over 100 years. As you can see JANUARY is one of the leading and strongest months, when you go and look back. December is also another strong, and well performer. 

january effect stock market


Why did I start out the column by suggesting a return of only about 30%? Please read on for the answer.

Why dips occur in certain stocks providing opportunities

The practical way to take advantage of the january effect stock market is to buy dips in certain stocks that may occur for the following two reasons:

1. Tax-loss selling. One strategy that is commonly employed by investors is to offset gains by taking losses on certain stocks. Such selling for tax purposes artificially depresses the price of certain stocks.

2. Window dressing. Portfolio managers in their year-end reports do not want to show investors that they were holding stocks that did not do well. Therefore they sell such stocks artificially depressing them further.

Two reasons behind the january effect stock market

The january effect stock market occurs for two reasons.

1. Investors buy stocks in January that were artificially depressed because of tax-loss selling in the prior year.

2. In January, Wall Street professionals get big bonuses. Those with big bonus prefer bargain stocks and drive up the prices of the stocks that were losers the previous year.

The conventional wisdom is that this january effect stock market applies only to small stocks. Our experience is that the effect is not limited to small stocks but applies to depressed stocks in general.

How to reduce risk

At The Arora Report, we advocate a basket strategy to reduce risk. The Arora Report has published a basket of 71 stocks to profit from the january effect stock market along with buy zones and position sizes. Most of the buy zones are below the market. The plan is to catch down spikes. Typically only 15%-25% of the stocks on the list get fills.

All stocks with fills will not be winners, there will be losers. Even some winners will have puny returns.Typically two or three stocks end up with monster returns.The average return typically ends up about 30% over three months.

When to buy

Thirty years ago, one could simply buy depressed stocks in the last week of December. Now that the phenomenon has become well known, the time to buy is earlier. These calls to buy remain valid until about Jan. 10. On Jan. 11, consider canceling all open orders that have not filled. After Jan. 10, the securities on the list that have not filled are no longer valid recommendations and are withdrawn.

When to take gains

Typically, gains are taken in the period of late January to early April.

Managing the trades

A practical way is to put in good-til-canceled orders (GTC). Consider putting small orders in tranches spread out in the buy zones. All orders will not fill. If there are not many fills, consider raising the order prices. Every year there have been a handful of stocks on the list that came within $0.25 of the top band of the buy zone and then went on to double. For this reason, aggressive investors may want to take liberty with the top end of the buy zones. If buying above the top band of the buy zone, consider reducing the quantity to reduce risk.

If you already hold some of the stocks in the basket, consider excluding those from your january effect stock market list.


Of course nothing is set in stone, and when we think of the stock market, and what it has been doing in the last 12 months, its been UP .... DOWN, and all around in 2015. To say its a very very volatile environment over the last few years, surely is an understatement. I seriously doubt that that will change in 2016 and onwards. But it can mean me big things, and a lot of our VIP MEMBERS HERE   are thriving in this time period basically because they are doing more things than the average trader out there. Well, technically they are not doing more things, they are just able to see the HUGE opportunities out there at the moment that others think do not exist. There are plenty of ways to make money. Sometimes when the carrots are dangling right in front of your eyes, its still hard to see them. If you know what I mean?

You have to look at the tree amongst the forest so to speak, when you have LOW INTEREST RATES, and violent swings on the market. BUY and HOLD strategies are almost a dying breed we would say, as more people realize you can make HUGE amounts of money on a smaller time frame in 2015, but you must be nimble, otherwise you can kiss your ass goodbye. :-D.... I am sure you know exactly what I mean by that. This is one of those markets that takes no prisoners, and asked no questions. It can cut you up, or can make you hit the jackpot super fast. 

 I cover more and more technical analysis ==> HERE in our VIP members section.


WHAT IF YOU KNEW WHICH WAY THE MARKET WAS ABOUT TO MOVE BEFORE IT HAPPENED?  CLICK HERE To Join Our VIP ELITE GROUP  -- FREE!


Powered by 123ContactForm | Report abuse