Web Statistics October 2015

Sunday, 25 October 2015

stock market bottom fishing

ACCESS OUT FULL PREMIUM ELITE VIP NEWSLETTERS & UPDATES!


 FREE 14 DAY TRIAL - CLICK HERE

See What The Fuss Is About - Try Us Free For 14 Days! - Limited Time Offer - Hurry!
Get access to our Daily analysis, videos, coaching, audio, charts and indicators AND MORE....


=====================================================

Stock Market Bottom Fishing ?


stock market bottom fishing ?

Is now a good time to be a good time to fish for a stock market bottom?

Odds are that the Halloween Indicator will be especially good for the stock market this year. We are only days away from Halloween, but in looking around the interwebs, we also founds some very very intersting charts for you to gaze apon. One of these fancy charts is below. Take a peek!.......

What we want to do before we go on our usual rant, LOL, is show you one very very powerful chart. Here below is a 30 year cycle chart of the dow jones. As you can see, circled on the chart below, in pre-election year [which is this year 2015] you normally see the stock market bottom out in or around OCTOBER of that year, and then you see a multi-year rally soon after wards. Have a look at the chart below. If that is what is happening here, things are slowly getting very very interesting. 
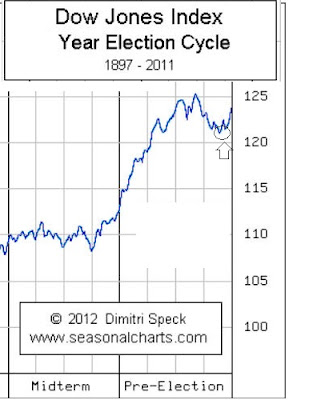
stock market pre-election cycles.


That’s encouraging news, since the Halloween Indicator WE TALKED ABOUT HERE already carries decent odds of success. But lets not jump the gun too quickly, hey!

But when the stock market is riding a wave of momentum into Halloween — as it most definitely is this year, including another 200+ point rally in the Dow Jones Industrial Average DJIA, +0.90%  on Thursday — it might get exciting for you, because the odds start becoming even better.

Let us delve deeper again, as we have talked about this before, but basically in layman's terms, the Halloween Indicator refers to the stock market’s seasonal tendency to produce its best returns between Halloween and May Day ( “winter” months). This indicator is also known to be as that age old saying from the big wigs on wall street “Sell in May and Go Away,” since those who mechanically follow it go to cash during the “summer” months (from May Day until the subsequent Halloween).


Notice from our "timing the nasdaq" chart above that the Indicator worked like a charm over the last year. Over the seasonally-favorable six-month period that began on Halloween 2014, the market gained 2.6% — versus a loss of 2.6% in the unfavorable summer months that began last May Day.

I was in conversation with a very smart trader over the weekend. This guy has made millions from trading the market. He again bought up the point that if you're investing for retirement, you should never ever, focus on the Fed and short-term rate hikes. You must always have a business plan, & Stick to your long-term investment goals. Then after that has been taken care of, you have to keep your eye out for sudden inflation and keep an eye on asset allocation during market cycles. As that is where investors will get caught up from time to time. Its the difference between being an an average investor and someone who makes a killing on the stock market consistently.

What’s particularly noteworthy about this seasonal tendency is that despite many analysts being skeptical about it, and saying brush these sort of charts off. The proof is in the pudding, as they say. Its been sticking like glues. So it might help your investing in the next 12 months. If anything, in fact, it’s been stronger over the last 15 years than it has ever been in the last 50 years. So its worth sitting up and taking notice of in the end of 2015. In the early 1990s that academic research into the these cycles and indicators were not really circulating widely, but now is pretty much a known fact, among smarter types of investors. Maybe its sort of one of those self fulfilling prophecy type events. We do not know, but we would be skeptical about that as well. When you are investing in the market, you do not know what happens today, tomorrow and into next week for that matter, but its always good to have some sort of a road map to follow. Any sort you can get your hand on, that has proven the test of time. This is one of those rare types of indicators, and its worth mentioning to our readers.

Also, it could proved to be even more powerful this year....Why?

SIMPLE....

These already-impressive statistical odds become even better when the stock market is able to buck the seasonal odds and eke out a gain over the September-October period — the last two months of the seasonally unfavorable summer period. That’s exactly what’s happened this year, with the Dow currently 5% higher than where it stood at the end of August.

For example, this research data has proven that : going back even to the late 1800s, the Dow produced an average Halloween-through-May-Day gain of 4.0% whenever the market was a loser over the two months prior to Halloween. And that is sort of the situation we have on our hands right now. So its another reason why we had to bring this to your attention going into NOVEMBER! This is the sort of information that could give you a clear advantage to other investors out there, who are have been getting slaughtered from the market volatility in recent times.

When it was a gainer, in contrast, the Dow’s subsequent Halloween-through-May-Day gain was 6.8%. This difference of 2.8 percentage points is significant at the 95% confidence level that statisticians often use to determine if a pattern is genuine.

Note that what we are saying is that a bear market won’t occur. In fact there are some charts that do alarm us, right now. And you have to remember the stock market rally over the last few weeks, has been pretty historical.  But if the future is like the past, the worst of any upcoming bear market will wait until after May Day of 2016 — since the bulk of market damage during past bear markets has occurred during the summer months. And that is also according to the indicator and cycle itself. Which has proven very accurate in bear markets also, just you know.

During the 2007-2009 bear market, for example, losses during the summer months were twice as big as those during the winter months. And again it continued to follow the cycles, and indicator we are making reference too. One thing to note is that they will not all repeat perfectly, like some analysts out there are claiming. NO! Its just another tool you should wear around your armory belt as a trader. The more tools you have, the better you are prepared for the trading year calendar. Remember, after all this game is all about timing, and getting in and out at the right time. If you don't you can lose your shirt pretty quickly no doubt. But all this could mean we are about to see some really nice opportunities rare their pretty little head in the coming 8 or so weeks. Time will tell.


All in all, we have seen lots of people calling for a crash, and the horrific end to the bull market. But what you have to remember that right now, the FED is for now keeping rates at record lows, the economy is still getting better, and the company reports that have been released in the last week have not been too horrific. We have more companies reports in the next week too, but this market is like might be in a situation where too many people got too bearish, too fast!!! So of that is anything to go by, these same people might be forced out soon, which will not only create alot of interest, but FRESH buying interest, which could turn the market round, and set us up on the next leg higher!

I mean, that is a real possibility here, we have lots of company reports being released in the coming week, so we will have to see about that. Nothing is set in stone. We could drop back to 1800 on the SPX by next Friday, but we do not buy into that sort of situation playing out, when you look at the chart above. Plus the fact that funds that closed out some of the positions back in MAY 2015, are now sniffing around and looking for safe areas to put their money back to work. And trust me when I say, there is definitely vehicles out there that represent safety and value. 


 I cover more and more technical analysis ==> HERE in our VIP members section.


WHAT IF YOU KNEW WHICH WAY THE MARKET WAS ABOUT TO MOVE BEFORE IT HAPPENED?  CLICK HERE To Join Our VIP ELITE GROUP  -- FREE!


Powered by 123ContactForm | Report abuse

Wednesday, 21 October 2015

The Warren Buffett Way - Investing Like A Guru

ACCESS OUT FULL PREMIUM ELITE VIP NEWSLETTERS & UPDATES!


 FREE 14 DAY TRIAL - CLICK HERE

See What The Fuss Is About - Try Us Free For 14 Days! - Limited Time Offer - Hurry!
Get access to our Daily analysis, videos, coaching, audio, charts and indicators AND MORE....


=====================================================

The Warren Buffett Way ?


Warrent Buffett Way
The Warren Buffet Way

There is hardly a man in the street who does not quote Warren Buffettisms and hardly an adviser or investment product that does not claim an empathy with his investment style. But the truth is there is
truth is love him, or actually hate him, as some do. Warren Buffett is one smart dude.

Also he is one rich dude! That is plain and obvious to see, so he is worth listening to, so I will get to that in a minute.

It's not even very hard, it's impossible, because so many elements of his analysis are so subjective. Getting stocks right is a very personal thing and I'm afraid if you really want Warren Buffett to be your adviser or your fund manager then there is no alternative but to ring him.

But let's face it now, the chance you have to be a phone call away from this great man, is slim to none. Yes! I am sorry, that sort of access is off limits unless you can quickly tear off a million dollar cheque out of your bank book, and slip it in his top pocket while he is looking, of course.

So in other words, you are going to have to look for a cheaper alternative, which we have found. See below. Lets face it, You are not Warren, and probably will never get to such heights, even if you lived to the ripe old age of 300. But the man has a simple set formula that almost anyone can read, and apply and create success and riches beyond their wildest dreams.

Today "The Warren Buffet Way". It's about Warren Buffettism and how every man in the street drops his name and claims to invest like him. The truth is, there is only one Warren Buffett and only one person that has his skill, and it's not you.

Warren Buffett is considered to be one of the greatest investors that has ever lived and is consistently ranked among the wealthiest people in the world with a net-worth north of $72 billion. He is well known for his commitment to value investing, and when he gives recommendations, people listen.

The other day I came across a quote from him where he was advising people to invest as much as possible in something that everyone has access to, something , he says, in which we can never invest too much.

What is this amazing asset he’s so bullish on?

It’s you.

“Invest in as much of yourself as you can, you are your own biggest asset by far.” — Warren Buffett
You will never get a better return on life than when you truly invest in yourself. Here are some ways to help you make the most of your investment.

Stay healthy on all three planes: mind, body, spirit.

“You only get one mind and one body. And it’s got to last a lifetime. Now, it’s very easy to let them ride for many years. But if you don’t take care of that mind and that body, they’ll be a wreck forty years later, just like the car would be.” — Warren Buffett
It all starts here. You need to be firing on all cylinders, or else you won’t be able to get the most of out your life.

This doesn’t have to be difficult or time consuming. Just be mindful about improving yourself. Here are some simple ways to do it:

Mind: read a book (even if it’s just one page a day), journal, come up with ideas.
Body: exercise (even if it’s just for 7 minutes), eat good food, drink plenty of water, get a good night’s sleep.

Spirit: pray (it doesn’t matter if you’re religious or not) or just says ‘thanks’, be kind to people, write a gratitude list.

Cultivate positive habits and stick to them with a daily routine.

How much better do you feel on the days that you do something good for yourself? Perhaps it’s the days that you exercise or maybe when you are really focused at work. Your days just seem to go smoother, don’t they?

You can have that every day. It’s just a matter of deciding what you want to do and following through with it.

Start small. Decide on one positive habit that you can start doing today, and then do it. Then do it again tomorrow. Once you’ve mastered one habit, you can put that momentum toward building a way to have the best day ever (every single day).

Never stop learning.

One of the greatest secrets to Warren Buffett’s success is that he is continuously learning. Charlie Munger, the vice chairman of Buffett’s Berkshire Hathaway Corporation, once said this about his legendary colleague:

“Warren Buffett has become one hell of a lot better investor since the day I met him, and so have I. If we had been frozen at any given stage, with the knowledge we had, the record would have been much worse than it is. So the game is to keep learning, and I don’t think people are going to keep learning who don’t like the learning process.”

Most people think that real learning ends when school is over but they are selling themselves way short. Life should be about continuous learning, and there are many ways for you to do this:

-- Attend conferences, seminars, and meet-ups.

-- Take a free online course.

-- Talk to people and ask them questions (listen more than you talk).

-- Research something you are interested in.

-- Travel.

Surround yourself with excellence.

“It’s better to hang out with people better than you. Pick out associates whose behavior is better than yours and you’ll drift in that direction.” — Warren Buffett

It’s been said that you’re the average of the five people you spend the most time with. In other words, who you spend time with influences the person you become.

Take a look at the people in your life right now and ask yourself these questions:

Are they making you better or are they bringing you down?
Are they mostly positive or are they typically quite negative?
Do you feel better when you are around them or do you feel worse?
If someone is a negative influence on you, then you have to kick them to the curb (or severely limit your time spent with them). This can be very hard when it’s a family member or co-worker, but if you want to become the best version of you, you are going to have to take action.

Spend time getting to know yourself.

“I insist on a lot of time being spent, almost every day, to just sit and think. That is very uncommon in American business. I read and think. so I do more reading and thinking, and make less impulse decisions than most people in business. I do it because I like this kind of life.” — Warren Buffett
Your time is extremely valuable and precious. Spend some of it getting to know yourself better. These practices can help you find out who you truly are:

-- Meditate (even if you think you can’t meditate).

-- Do yoga.

-- Write morning pages or journal.

-- Find hobbies that you enjoy (and actually do them).

Do what you love to do.

“There comes a time when you ought to start doing what you want. Take a job that you love. You will jump out of bed in the morning. I think you are out of your mind if you keep taking jobs that you don’t like because you think it will look good on your resume. Isn’t that a little like saving up sex for your old age?” — Warren Buffett

You only have one life to live, why not live it to the fullest?

Invest as much as you can in yourself starting right now, and you will see returns beyond anything you could dream of


 I cover more and more technical analysis ==> HERE in our VIP members section.


WHAT IF YOU KNEW WHICH WAY THE MARKET WAS ABOUT TO MOVE BEFORE IT HAPPENED?  CLICK HERE To Join Our VIP ELITE GROUP  -- FREE!


Powered by 123ContactForm | Report abuse

Sunday, 18 October 2015

when will bull market end

ACCESS OUT FULL PREMIUM ELITE VIP NEWSLETTERS & UPDATES!


 FREE 14 DAY TRIAL - CLICK HERE

See What The Fuss Is About - Try Us Free For 14 Days! - Limited Time Offer - Hurry!
Get access to our Daily analysis, videos, coaching, audio, charts and indicators AND MORE....


=====================================================

Will the bull market end in 2015 ?


It's a question on everyone lips, and probably yourself while you read this blog, right?

Are Stocks are likely to rise as 2016 approaches? Or are we at the forefront of a 2008-like situation, where stocks and many asset classes about the drop like a rock!?

It's a good question to ask, and we think with the nervousness out there right now its about time that we delve deeper, take a look at some good charts, and try to peer into the future when the time is right!

U.S. stocks closed higher Friday for a third week of gains as mixed data pushed out expectations for the timing of the first rate hike, and that has alot of money managers out there scratching their head, and wondering what the hell to do, going into Christmas 2015.

You see there are a lot of underexposed money managers out there scratching their heads, as you read this. Some of them have been losing money left, right and centre, but the smart ones may be buying especially after the dramatic dip we experienced back in AUGUST 2015 and as the market seems to be recovering quite nicely in the last few weeks.


IF we look back to Less than a week ago you can see that the Dow Jones chart was sitting around 16,000 again and at the same time, there were many stocks  hitting new 52-week lows. If you were one of the ones that paniced and sold off everything in your portfolio, like some out there did, you would be kicking yourself today, because after the employment numbers stocks rounded off, and are majorly off the lows right now. When you look at the market, we have sort of put in what looks to be a double bottom, or what is termed a "W" pattern [a term known to many technical analyst]

The thing is, that W pattern could be very subjective. We could be either putting in a major bottom, or we are just in a sort of dead cat bounce, before another dramatic selloff occurs.


The thing is, when you look at the DOW chart above,  that W pattern could be very subjective. We could be either putting in a significant and major bottom, or we are just in a sort of dead cat bounce, before another dramatic selloff occurs.

We have major earnings being released this week. And some out there are saying that could really take the jam out of the doughnut. :-)

Even if the JAM is taken from the doughnut, we do think its a bit premature to be calling the end of the bull market here. When you have a look at the monthly Russell chart, you can see there is a major upwards channel here, now we are down at the bottom of this major monthly bottom channel, its a bit nervous, but to call the end of the bull market, right now would probably be a bit of an oxymoron.


Dow Industrials' have had their best winning streak since July: The markets have had a nearly 5% straight up move since the most recent bottom was put in last Friday morning. On the one hand, there's that old SPOOKY saying that has merit: "The biggest rallies happen in bear markets." On the other hand, that Friday bottom is a higher low that the chartists will have to respect. I still think there's a lot of money managers out were worried and in a state of panic we could get a 2008-like meltdown but are now starting to cover/buy more stocks as the market runs away from them.

This market is on a dime right now, and there is more than a possibility that we drop like a rock back to the August lows, but touch wood, the path of least resistance for stocks and assets in the coming months, might be the upside. That is our best guess.

So the market is a little subjective. You have brokers out there saying, we are about to drop and experience the continuation of the AUGUST crash, we are just taking a little breather here. And then again you have others who keep saying the market is in a major bottoming pattern because the lows of the market were tested, and they failed to get below.

SO WHO DO YOU BELIEVE, THEN?

Well.....

Its plain and obvious to us, that at the end of 2015 there are  reasons to be bearish are actually reasons to be bullish too. 

And in addition to those, lower stock prices are making me more optimistic. The stock market is far less volatile in OCTOBER than it was several months ago. So that might be a tick of those in the bulls camp. But just a few months ago, we have to remember that most Investors were too scared to get back into the market, and others were too scared to get out. The way we see it is that many investors out there are still complacent.

Things have turned more bullish suddenly.  All the factors (noise) like Fed interest rate hikes, China’s market, the oil price drop, strong U.S. dollar, which are important to many in market, haven't changed much. Also, if you ask who is scared more right now, I guess we would get 50-50, which means we are not trading opposite to the crowd.

But let's run through each of your so-called bearish points and see why they're actually probably bullish. We've been hearing about a Fed rate hike nonstop and I don't believe that moving interest rates from 0% to 0.25% or even to 1% is going to stop people from seeking higher risk assets like stocks since rates are just too low.

China's consumer class is going to grow by millions of people this year and next. Oil and energy price drops are good for other businesses and all consumers around the world. A strong U.S. dollar means that every dollar I get paid with is more valuable than it would be otherwise, and I want what I get paid in to have more value, not less. So I actually find most of those economic trends you're citing to be quite bullish, not bearish. And stocks have come down 30%-50% almost across the board, which is also bullish in my mind.

We're sort of moving sideways on the sentiment front, and Right now looks like the Treasury market is certainly in a pretty narrow range, which is not surprising given the increasing consensus on the Fed (raising rates later), and its going to make people more nervous in the next week.


All in all, to people calling the end of the stock market bull at the end of 2015 is just plain crazy. You have to remember that this market has been like a freight train for many years now. Although 2015 has been a volatile year and tricked many traders we must remember that every time we get a significant dip, they are bought into. So that could be a little warning that this bull market is indeed not starting to end, but just taking a well deserved rest, before the next upside rally starts to show.

Remember, bull markets do not go up in a straight line. Basically we have been witness to many bull markets, and they tend to go 2 steps forward, and then one step back. And those are all the hallmark signs we have right now. We might be just stepping back for a bit, before we see fresh and new highs by Christmas 2015? Well, that is just a guess on our part.  Of course that can all change, simply put, but you have to realize that bull markets do not just turn on a dime and finish in a day, or a week or even a month. They take time. If there is a bear market starting, well, you will know about it that is for sure. It will not be raining stockbrokers, but you will see panic like we saw back in 2008. So far we have not seen the beginning signs of all that thank goodness, but if we do you will be the first to know. :-)


 I cover more and more technical analysis ==> HERE in our VIP members section.


WHAT IF YOU KNEW WHICH WAY THE MARKET WAS ABOUT TO MOVE BEFORE IT HAPPENED?  CLICK HERE To Join Our VIP ELITE GROUP  -- FREE!


Powered by 123ContactForm | Report abuse

Sunday, 11 October 2015

A Spooky Stock Market Indicator - Halloween Idicator


ACCESS OUT FULL PREMIUM ELITE VIP NEWSLETTERS & UPDATES!


 FREE 14 DAY TRIAL - CLICK HERE

See What The Fuss Is About - Try Us Free For 14 Days! - Limited Time Offer - Hurry!
Get access to our Daily analysis, videos, coaching, audio, charts and indicators AND MORE....


=====================================================

A Spooky Stock Market Indicator ?


Are Followers of the so called Halloween Indicator about to time their move back into the market soon. Let us explain below....

We talked about this in our recent ==> VIP NEWSLETTER HERE just a few days ago
 
It seems that alot of the Wall Street gurus are obsessing about a possible bear market and when to get out of the stock market, however there is one group of investors poised to get back in.  Those who sold in May might be looking to return to stock market. I am referring to followers of the so-called Halloween Indicator, Let us explain exacty what this is, if we do have your attention.

The Halloween indicators is based on the historical tendency for the stock market to produce almost all of its net returns between Halloween and the May Day six months later. Its sometimes known at the BEST PERFORMING time for the market, in a calendar year. It promotes the action for a trader to  “Sell In May and Go Away” {or get out of the market and go to cash} for six months, safely parked in cash until reinvesting it the subsequent Halloween. {where a trader would get off the sidelines, and buy back in to the market}

This Indicator has worked like a charm this year, of course. The Dow Jones Industrial Average DJIA, +0.20%   is 10% lower than where it was last May Day, which means that followers of the Halloween Indicator this year are that much ahead of a buy-and-hold strategy for doing nothing more difficult than go to cash when the calendar turned from April to May.

That’s remarkable, since most market-timing strategies don’t even equal the market’s return, much less beat it. So there is some respect that one needs to give this helpful statistic.

Though “Selling In May and Going Away” doesn’t always work out as well as it did this year, it has done so far more often than not. One academic study, for example, found statistically significant evidence of this pattern’s existence in the histories of the more than 100 countries around the world that have stock markets. In the case of the United Kingdom, that meant the study analyzed data back to 1694. That is a pretty good statistic we think, as the data on our charts does not go back that far. :-)

This impressive history might very well convince you to follow this indicator mechanically, which would mean waiting until the last trading day of this month before re-investing the cash raised in the spring. But on some occasions that was either too late, or two early for the trade to take place. Two advisers I track have been unwilling to leave well enough alone, however, and over the last decade have created timing systems that attempt to pick better re-entry points than Halloween (and better exit points than May Day).

What you need to use in conjunction with the HALLOWEEN INDICATORS is the weekly charts and a MACD indicators to pinpoint the precise day on which to enter stocks in the fall and exit in the spring. (MACD is a short-term momentum indicator, standing for moving average convergence divergence.) MACD is one of the signals large funds and institutes use to time the market as well.

This market timer of this seasonal pattern dating back to mid-2002, nearly 13 years ago. The HFD calculates their returns on the assumption that, when they are invested in stocks, they earn the return of the Wilshire 5000 Index W5000, did quite well. It did not win every year, but the years everything aligned it made significant profits. It is in no way a guarantee that things will turn out the same in 2015 this year.

Also when you take a look at the stock market or the S&P 500 on a weekly chart you can see that this chart would agree, with this indicator or Halloween factor. However, right now or this year in 2015 we seem to be stuck in an annoying range, which is quite violent, and neither the BULLS nor the BEARS seem to be winning.

 You can see the MACD is still on a weekly SELL signal, but one thing about this which is blatenly obvious, is the the MACD is starting to really turn up hard. So that could be a warning sign for us. Eventually we are going to have to bust out of this violent range. See the chart below.....

SPX WEEKLY CHART

Almanac Investor’s modification of “Sell in May and go away” a saying that is basically talks about retail and some professional investors who sell in MAY, a time on the stock market, when seasonally things start to get really bearish, or negative, and then come back around HALLOWEEN time to place fresh buys on the market.

 Mechanically going to cash every May Day and re-entering the market on Halloween would have done slightly better with a lot less risk if you had done this over the last 20 years. However it does not work every year looking back. — But when you look back, if you had followed these rules you could have comes out well ahead of buying and holding on a risk-adjusted basis (as indicated by a higher Sharpe Ratio).

The Halloween Indicator did even better still, producing an 8.8% annualized return over the same period — 1.6 percentage points per year more than a purely mechanical application of this seasonal pattern, and 1.4 percentage points ahead of a buy-and-hold. Even better, this market-beating return was produced with 39% less risk, which means it’s even further ahead of a buy-and-hold on a risk-adjusted basis.

While the Almanac Investor’s modification of the Halloween Indicator performed less well than Harding’s, producing a 7.4% annualized return while incurring 36% less risk than the market itself, it still came out ahead of buying and holding, however, on both an unadjusted and a risk-adjusted basis. And, on an unadjusted basis, it did better than the mechanical version of the Halloween Indicator.

What about this coming October? I guess, no one really knows the future. If we did, everyone would just quit their jobs and trade the stock market right!? But, there’s no way of knowing when in coming sessions the exact time of getting back into the stock market. In past years, however, a preferred re-entry date was on Oct. 16, using this so called Halloween indicator and only then if MACD was on a buy signal. If it was not, he would delay re-entry until it was. So this is an interesting element because that date is literally just a few days away. Not only that, things are starting to line up as well.

 Another fact to consider is that a trigger for a re-entry can sometimes happen as early as the beginning of October, if the MACD is on a buy signal. That’s not yet the case, given the market’s recent weakness, including a Dow decline on the first trading day of October. But stay tuned: A sharp rally for more than a day or two [if that was to occur] could very well persuade a flash buy signal when you look at the charts above...

 Yes, its not spooky at all really. Halloween is a time for giving, and maybe the market is about to deliver a present and make some bulls out there very happy, While at the same time....punch the bears in the guts. But OPPORTUNITIES are presenting themselves very nicely and if I had to say one thing here, even though the sell off in AUGUST swooped in fast on us, it still does not mean that the end of the BULL MARKET is here. Of course that could turn out to be a horrific call, in a few months from now, but the action we see and the range we have been stuck in for weeks now eventually has to experience a big break, either up or down, and my guess is that we are weeks away from this sort of move.  


 I cover more and more technical analysis ==> HERE in our VIP members section.


WHAT IF YOU KNEW WHICH WAY THE MARKET WAS ABOUT TO MOVE BEFORE IT HAPPENED?  CLICK HERE To Join Our VIP ELITE GROUP  -- FREE!


Powered by 123ContactForm | Report abuse

Monday, 5 October 2015

Is The Stock market 2016 A Train Wreck Waiting To Happen?


ACCESS OUT FULL PREMIUM ELITE VIP NEWSLETTERS & UPDATES!


 FREE 14 DAY TRIAL - CLICK HERE

See What The Fuss Is About - Try Us Free For 14 Days! - Limited Time Offer - Hurry!
Get access to our Daily analysis, videos, coaching, audio, charts and indicators AND MORE....


=====================================================

Is The Stock Market 2016 A Train Wreck Waiting To Happen?


Some of our predictions have been stellar this year, and our members are quite happy. People are sick of losing money on the market especially with all this volatility that is about at the moment. One day the stock market is up, and ten the next week, its right back down. It's sending trading gurus nutty. LOL, and everyone else is tearing their hair out. But are these huge swings on the market, a sign of impending doom, and hinting towards some sort of catastrophic doom that is about to visit our markets. Like a grim reaper silently stalking in the long grass ready to pounce when no one is looking?

There are some pundits out there, basically shrieking and screaming about this market and telling everyone to panic. Basically to us, it feels like a fox has been let among the pigeon pen. :-)

But before we tell you to push the panic button, we must remind you to some of our comments, back in March we talked about Billionaire investor Carl Icahn who is no shrinking violet tell his audiences around the world about the dangers of the high yield market.

The HIGH YIELD chart below. You can see that since JUNE of 2015, it has been putting in a series of FRESH and new lower highs, and in a down-trending channel. The top falling resistance line is drawn below.  


After looking at this chart, basically we can say that high yield credit right now is a "very problematic", with no quick fix solution" and we can lay out the reasons why a turn in the credit cycle is could be underway.

The dramatic rout of commodity prices is having a spillover effect on corporate bonds, especially those linked to energy. Last week, ratings agency Standard & Poor's said the speculative-grade corporate default rate jumped to 2.5 percent in September, its highest level since 2013. That figure is expected to rise to nearly 3 percent by the middle of next year.


If this sort of action continues especially in the credit and energy sectors, you're going to see defaults pick up. We do not think this is just about the various metals, or commodities story, this isn't just metals and mining and energy. It's alot broader than that when you delve in deeper. And the fundamentals are as poor as they have ever been.

The High Yield Corporate Bond ETF has dropped nearly 5 percent in the past month!!! That is quite a dramatic move, and caused us to raise our eyebrows. So far this year its down almost 10 pecent. On Friday, the ETF hit a 52-week low on an intraday basis. Its a horrible thing to watch, and a bit of a warning sign.

CRUDE OIL

The lower oil prices go, the more stress is being placed on the high-yield bond sector. So we are watching crude like a hawk the last few weeks. Evidence is mounting that the outlook is unlikely to improve anytime soon. But we will keep watching these energy sectors in the next few months, and update our members. Last week, ratings firm Moody's said its high-yield Liquidity Stress Index fell in September amid a rash of energy company downgrades.

The fact that everyone is overlooking is that 50 percent of sectors in Bank of America's high-yield index have had negative price returns for the past five months in a row. OUCH, if you are unaware, that has not been recorded since late 2008, and we all remember that TRAIN WRECK. YES! Basically that was the HEIGHT of the GFC and horrific stock market crash the ruined lives, and sent other people loopy, in a panicked state of fear. You could literally hear some of the nutters in the street at midnight cry out..... THE END IS HERE!!!.....YES......THIS IS THE END!!!

{although it really wasn't}

A large part of the weakness we have have witnessed is due to the FED not propping things up anymore....yes you can remember how well the market was being supported by the fed's stimulus program, over the last few years, and now or lets say in recent times, that has come to an end, and its creating massive volatility in these markets!

The excess liquidity from the Fed's massive bond buying and super-low interest rates have created an environment where high yield corporate's have been able to gather funding at incredibly cheap levels, you can see evidence of these week to week. At some point, unless you have meaningful earnings, you can't sustain incredibly high leverage indefinitely.

Since the Fed started tapering all of its bond purchases, we have noted $30 billion has quickly flowed out of the high yield bond market. Those who have been flushed out of the market, are basically retail traders or weak hands.

But we must tell you, that the problem is much bigger than retail cash leaving the junk bond market. As you know we are full on technical analysts, however this is a story about pure fundamentals, and that actually, is much worse, because it takes it from a technical story to a fundamental story. The cracks are starting to appear, however from a technical perspective and a fundamental one, we do not think its time to panic yet. But it is a warning shot across the bow, that is for sure.

As for when the train wreck could turn into a full-on catastrophe, said it's likely to be a slow-moving process. And by no means to we think the bull market since 2009 has finished. We just think this situation is probably death by a thousand cuts until eventually in the end it could end up in heart ache and tears. The timing will be another thing, we do not know if the worse will happen today, tomorrow, next week or even next month. But what we think is happening, means that its going to be a very lucrative time as an investor!

 Yes, now has never been a better time to pick up bargains, and make huge gains with the volatility you are seeing on the market. Someone who knows what they are doing could make off like a bandit, and some of the charts, and asset classes we are looking at have huge potential going into XMAS. Most people forget, when other people see PANIC, and VOLATILITY, smart people see BARGAINS and OPPORTUNITIES for the plucking. 


 I cover more and more technical analysis ==> HERE in our VIP members section.


WHAT IF YOU KNEW WHICH WAY THE MARKET WAS ABOUT TO MOVE BEFORE IT HAPPENED?  CLICK HERE To Join Our VIP ELITE GROUP  -- FREE!


Powered by 123ContactForm | Report abuse
Saturday, 3 October 2015

us stock market predictions 2016

us stock market predictions 2016

While 2016 stock market crash predictions are everywhere right now you need to realise, that there are simple strategies that can make your 2016 stock market predictions.

We have leading software that is making it easy to forecast the stock market predictions 2016 

us stock market predictions 2016 can be guessed, but realistically we have the software that does all the hard work for us, and has been very accurate in 2015. Infact one of our most recent trades took 40% in profits. In just a few days. So if that is anything to go by, 2016 will be an exciting year no matter what anyone out there is saying.

Where will we go NEXT on the stock market? You be the judge..

you can get all our us stock market predictions 2016 HERE

us stock market predictions 2016


 I cover more and more technical analysis ==> HERE in our VIP members section.


WHAT IF YOU KNEW WHICH WAY THE MARKET WAS ABOUT TO MOVE BEFORE IT HAPPENED?  CLICK HERE To Join Our VIP ELITE GROUP  -- FREE!


Powered by 123ContactForm | Report abuse