Web Statistics The Sentiment Trader
Showing posts with label Nasdaq Hourly Chart. Show all posts

Tuesday, 10 May 2016

NASDAQ hourly chart


ACCESS OUT FULL PREMIUM ELITE VIP NEWSLETTERS & UPDATES!


 FREE 14 DAY TRIAL - CLICK HERE

See What The Fuss Is About - Try Us Free For 14 Days! - Limited Time Offer - Hurry!
Get access to our Daily analysis, videos, coaching, audio, charts and indicators AND MORE....


=====================================================

Nasdaq HOURLY CHART


Nasdaq hourly chart

so we have seen a whole lot of  motion in the ocean of the stock market, and the last few hours we have seen the stock market rally a bit.

Here is a chart of the Nasdaq hourly. You can see we are inside a very nice steep upward channel, and stochastics [indictor] on the hourly chart, is overbought.

We are also trying to punch through the 136 EMA [exponential moving average] THE RED LINE!

So, things could get interesting in the next 24-48 hours.


NASDAQ hourly chart


 I cover more and more technical analysis ==> HERE in our VIP members section.


WHAT IF YOU KNEW WHICH WAY THE MARKET WAS ABOUT TO MOVE BEFORE IT HAPPENED?  CLICK HERE To Join Our VIP ELITE GROUP  -- FREE!


Powered by 123ContactForm | Report abuse

Tuesday, 22 October 2013

nasdaq update

nasdaq update

There really is nothing more to add at the moment, the market is still bullish and going full steam ahead, the delayed jobs report and other negatives around the market are plainly just not getting it down.

It is like the market has taken a sip of party punch that consists of liquid VIAGRA and also RED BULL, and this is the results.

The market has been rallying for days, and my thoughts are the bulls are no where near dead, leading on to the end of the year.

The nasdaq hourly chart is powering ahead in droves.

nasdaq hourly chart
 nasdaq hourly chart

WHAT IF YOU KNEW WHICH WAY THE MARKET WAS ABOUT TO MOVE BEFORE IT HAPPENED?  CLICK HERE To Join Our VIP ELITE GROUP  -- FREE!


Powered by 123ContactForm | Report abuse

Thursday, 12 September 2013

nasdaq hourly chart

nasdaq hourly chart

You can see on the NASDAQ hourly chart things are too overbought at the moment and it looks as though some sort of sell off is on the way! This rallying over the last few days was on CHINA'S good news and the fact that OBAMA thinks he has sorted the Syrian Crisis by trying to make Asad hand over chemicals weapons! Something tells me that this plan is going to go horribly wrong!, and ensure you read my next post today, as I have a theory and evidence the SYRIA crisis is far from over in my eye.

Anyway, the chart rule for now and so far the hourly chart is still overbought and we might get some follow through selling coming soon.

nasdaq hourly chart
nasdaq hourly chart


WHAT IF YOU KNEW WHICH WAY THE MARKET WAS ABOUT TO MOVE BEFORE IT HAPPENED?  CLICK HERE To Join Our VIP ELITE GROUP  -- FREE!


Powered by 123ContactForm | Report abuse

Tuesday, 15 January 2013

Market Update - Latest market update

Well yesterday we warned a FALLING BULLISH WEDGE had formed. It seemed we were spot on => SEE LINK HERE!

It seemed that played out perfectly. :-)

First have a look at the leader of the market, the Dow Jones transports. It is in a very nice uptrend and holding very well. 

This has been a freight train, We have only had a few red days since the 5200 level. 

dow jones transportation
dow jones transportation 


The Summation or market breadth has clearly been signaling to NOT FALL IN LOVE WITH THE DOWNSIDE, and that has been correct. We are still on a BUY DIPS stance and nothing has changed for now. We need to continue to monitor this chart in the coming weeks, but for now as said, we are still in a buy the dips position on the market. 

summation chart
summation chart


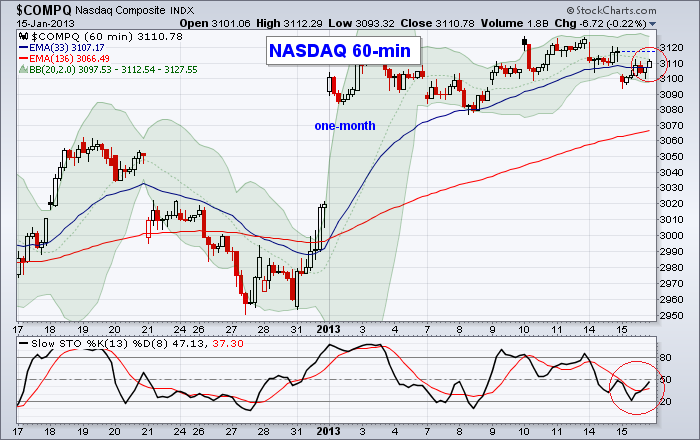
The nasdaq has been going sideways the last few days, but the hourly chart below is signaling we are oversold again, and some sort of bounce is coming. 

nasdaq hourly chart
nasdaq hourly chart


WHAT IF YOU KNEW WHICH WAY THE MARKET WAS ABOUT TO MOVE BEFORE IT HAPPENED?  CLICK HERE To Join Our VIP ELITE GROUP  -- FREE 10 Day Trial Offer Today! 

Tuesday, 8 January 2013

Nasdaq Hourly Chart

Nasdaq Hourly Chart

Today we posted an update HERE on the nasdaq chart. We made some notes on how the nasdaq the last few days, has been doing nothing more than just coiling or in a low range tight price pattern and working out where it wants to go next.

If we have a look at the HOURLY Nasdaq chart, we can see that the very quick upwards rally has left a gap on the chart. This is highly unusual and we must warn you that these gaps do eventually close, sooner or later.

For now, however, since the 3rd of January we have topped and just going sideways, however on the nasdaq chart   the nasdaq seems to have found a bit of support, and we are oversold on the hourly, which means that in the next few days it is probable we will see some sort of bounce, and even a break out to the upside, depending on how strong the bulls feel.


Nasdaq Hourly Chart
Nasdaq Hourly Chart


WHAT IF YOU KNEW WHICH WAY THE MARKET WAS ABOUT TO MOVE BEFORE IT HAPPENED?  CLICK HERE To Join Our VIP ELITE GROUP  -- FREE 10 Day Trial Offer Today!