Web Statistics January 2014

Thursday, 30 January 2014

Will History Repeat

Will History Repeat

Will History Repeat

U.S. stocks are on pace to close a volatile January in the red, after posting the best yearly gain in 16 years.

Will History Repeat ?  .....

The S&P 500 settled at 1,774.20 on Wednesday, down 4 percent for the month, on track for its first January loss since 2009, and the largest monthly decrease in eight months. Similarly, the Dow is off by 5 percent this year, while the Nasdaq has fallen 3 percent.  As January goes, so goes the year?

There is that saying on wall street.... "As January goes, so goes the year?"

I guess it is just a saying, but we shall see.

The market has taken a bit of a dive, however today we got back in our sideways range as you can see below.

Will History Repeat
Will History Repeat


WHAT IF YOU KNEW WHICH WAY THE MARKET WAS ABOUT TO MOVE BEFORE IT HAPPENED?  CLICK HERE To Join Our VIP ELITE GROUP  -- FREE!


Powered by 123ContactForm | Report abuse

Wednesday, 29 January 2014

dow jones transports update

dow jones transports update

dow jones transports update

So far in 2014 the market has not been performing very well.

The leader of the market or the dow jones transports is an interesting chart right now. If you see this chart below it clearly shows that every time we hit the 50 period Exponential moving average line we stall. So far over the last few years it has been somewhat of a line in the sand.

So it is uncanny we have stopped dead cold back at this line. The next couple of days will be critical for the bulls and bears and to give the market more clarity.


dow jones transports update


 WHAT IF YOU KNEW WHICH WAY THE MARKET WAS ABOUT TO MOVE BEFORE IT HAPPENED?  CLICK HERE To Join Our VIP ELITE GROUP  -- FREE!


Powered by 123ContactForm | Report abuse

Sunday, 26 January 2014

rally under pressure

rally under pressure

rally under pressure

Make no mistake about it, the nasdaq with troubles in CHINA and earnings, and with the whisper of tapering back on the table in the US, and the nasdaq is again under a bit of pressure. As you can see, we are back close to the 3 1/2 trend line, and I am not really surprised this has been holding pretty well.

There are a lot of people, blog writers and pundits saying this is start of a crash, however we have been hearing that for years now and still the market kept headed higher. So it is too early to call a crash here.  2-3 down days on the market is not a crash, I am still under the impression we are still in a bull market, and even in bull markets prices cannot just go up in a straight line.

Now at the end of JANUARY we can see the market has basically done nothing more than go sideways and it is a slow daily grind. My guess is this will continue. However prepare for headwinds the middle of this week when the US FED meeting takes place. Maybe they have a big announcement up their sleeve, who knows, but remember last time this took place the market was really whippy so do tread carefully this week and remember your stops.


rally under pressure


 WHAT IF YOU KNEW WHICH WAY THE MARKET WAS ABOUT TO MOVE BEFORE IT HAPPENED?  CLICK HERE To Join Our VIP ELITE GROUP  -- FREE!


Powered by 123ContactForm | Report abuse

Thursday, 23 January 2014

financial sector update

financial sector update

financial sector update

Right now the market is taking a short break we believe. As you can see the telltale sign is the financial sector! As of today the financial sector has broken its nice rising support line, and MACD is still on a SELL SIGNAL. This is not a good sign for the short term, so further selling could be witnessed in the coming days / week.

We have been trading in a range for weeks and finally after a day of heavy selling in earning weeks, the financial did cop a beating and broke down out of this range (to the downside). There is a possibility we go down to 21, as today was a significant day for the bears.

financial sector update


WHAT IF YOU KNEW WHICH WAY THE MARKET WAS ABOUT TO MOVE BEFORE IT HAPPENED?  CLICK HERE To Join Our VIP ELITE GROUP  -- FREE!


Powered by 123ContactForm | Report abuse

Wednesday, 22 January 2014

market update - red light green light

The market is in one of those states, which is common at the start of the year. We are still in a hangover from 2013, we are in earning season, and the market is trying to work out a direction.

Right now as you can see on the S&P we have been going sideways since new years. The bulls are not winning, but neither are the bears by any stretch of the imagination.

To get some clarity we will need to break the highs and or the lows. So far the tussle continues. Due to the bull market characteristics, we have been seeing in this market, we tend to think some more upside is coming. However the timing is anyones guess.


WHAT IF YOU KNEW WHICH WAY THE MARKET WAS ABOUT TO MOVE BEFORE IT HAPPENED?  CLICK HERE To Join Our VIP ELITE GROUP  -- FREE 10 Day Trial Offer Today! 

Saturday, 18 January 2014

spx weekly chart update

spx weekly chart update

For now despite the many skeptics out there, and those who are allegedly in the know. This market is still in a bullish position. If you take a look at the weekly chart, this market has been shrugging off debt ceilings, tapering, bad earnings, and all the rest. And without even taking all that into account you can see that the market remains within its very nice upwards channel lines.

Ok, eventually this market is going to need to take a break soon, and we are the first ones to admit that, but for now we would not be surprised if we saw 1900 on the SPX soon. Or targets would be within the 1890 - 1900. Some might laugh at those levels, but one must remember the market can remain at unrealistic levels before traders out there become insolvent.

Honestly, it was a brutal year for the bears last year, infact the last few years the bears have been hugging the porcelain dry reaching to what they have become witness too, but I do have a funny feeling the bear carnage is not over yet. Once again take a look at the weekly chart below. 

Uptrend remains intact for now.

spx weekly chart update


WHAT IF YOU KNEW WHICH WAY THE MARKET WAS ABOUT TO MOVE BEFORE IT HAPPENED?  CLICK HERE To Join Our VIP ELITE GROUP  -- FREE!


Powered by 123ContactForm | Report abuse

volume chart

volume chart

After dropping a mere 1.8 percent from its December 31st historic high in the first two weeks of January, the S&P 500 closed at an historic high yesterday on the heaviest volume since November. If you do any form of technical analysis, things actually are looking pretty good here, I must admit!

This week was another shallow pullback of the sort that has been typical of the past two years.

The worst decline of last year was a 7.5 percent pullback in the S&P during May and June, when then Fed Chairman Ben Bernanke first broached the possibility that the Federal Reserve would be winding down its stimulus program.

I have to say the market still is holding pretty well, after many analysts out there were saying the market was going to crash first thing in 2014 the market has pretty much done nothing at all.

The volume chart since the end of DECEMBER 2013 is increasing in volume, and price. This is not a bearish situation. So again we would not be surprised to see higher prices coming on the indicies soon. Just a guess, so we will take it one day at a time.

volume chart
volume chart


WHAT IF YOU KNEW WHICH WAY THE MARKET WAS ABOUT TO MOVE BEFORE IT HAPPENED?  CLICK HERE To Join Our VIP ELITE GROUP  -- FREE!


Powered by 123ContactForm | Report abuse

Thursday, 16 January 2014

spx market update

Nothing much to report about the market. All is cool in bible school.

What I can say is that the market is in quite a tussle right now with the bulls and the bears.

Support is about the 1815 region and resistance lies around the 1840 region. The market has been sea-sawing back and forth between these two levels. :-)

CLICK HERE to get more indepth analysis and levels here IN OUR VIP MEMBERS SECTION

spx market update
spx market update


  WHAT IF YOU KNEW WHICH WAY THE MARKET WAS ABOUT TO MOVE BEFORE IT HAPPENED?  CLICK HERE To Join Our VIP ELITE GROUP  -- FREE!


Powered by 123ContactForm | Report abuse

Tuesday, 14 January 2014

what the bulls are not seeing

what the bulls are not seeing

the market has been going no where lately, just in an annoying sideways action on the market.

But there is one thing most traders are missing when i comes to the indicies.

LEFT : DOW JONES - The DOW JONES is really lagging and not letting the market get ahead of itself. As you can see it is dragging its leg and not letting the other indicies move higher. 

RIGHT : S&P 500 - Ths S&P is (right side) looking to be in a bullish flag pattern, however it is not finding momentum right now, and edging its way to sideways / down.


WHAT IF YOU KNEW WHICH WAY THE MARKET WAS ABOUT TO MOVE BEFORE IT HAPPENED?  CLICK HERE To Join Our VIP ELITE GROUP  -- FREE!


Powered by 123ContactForm | Report abuse

Monday, 13 January 2014

New Credit Bubblette - Alarming credit bubblette chart

New Credit Bubblette - Alarming credit bubblette chart

Here is a very dramatic chart of the current housing loans. As you can see in the last few years it has dramatically risen, and paving the way for what we could term a credit bubble 2.0 or a bubblette.

Even though the economy is in the shambles right now, the last 12 months for housing loans has been risen so dramatically even larger than it was in the middle of the housing boom several years back....so are we seeing the start of another property boom? Well.... things are starting to point in that direction.


WHAT IF YOU KNEW WHICH WAY THE MARKET WAS ABOUT TO MOVE BEFORE IT HAPPENED?  CLICK HERE To Join Our VIP ELITE GROUP  -- FREE!


Powered by 123ContactForm | Report abuse

Sunday, 12 January 2014

russell chart udate - russell chart udate

russell chart udate

Russell chart update is below. As you can see and in our VIP MEMBERS SECTION
We do more analysis with this, however we are looking at this chart and determining if this is a bull flag or now. So far since the larger traders have come back to their desk, that could be a real possibility. However there are many problematic news and events coming soon such as the DEBT ceiling agreement.

But this could be a bullish flag pattern that has broken? Time will tell.

russell chart udate
russell chart udate


WHAT IF YOU KNEW WHICH WAY THE MARKET WAS ABOUT TO MOVE BEFORE IT HAPPENED?  CLICK HERE To Join Our VIP ELITE GROUP  -- FREE!


Powered by 123ContactForm | Report abuse

Thursday, 9 January 2014

Taper talks and jobs

Taper talks and jobs

U.S. stocks closed little changed Thursday, with investors unwilling to place large bets ahead of Friday's employment report, as corporate earnings and thoughts of accelerated tapering by the Federal Reserve were also in view.

The markets are still a little worried, but eventually there will be a shift in focus from taper, taper, taper to earnings.

In terms of the market there really is nothing much to add. For most of this week, even though some big news items have been out, we have been in nothing more than an annoying range. We will need to see some sort of breakout in either direction for some clarity. This is normal for JANUARY so I do not know why traders out there are expecting some sort of miracle or power move coming off the back of the holidays, we just have to sit and wait it out.

Maybe we get something FRIDAY with the much anticipated jobs report. As said, you can see below the nasdaq is still in a range.

Taper talks and jobs


WHAT IF YOU KNEW WHICH WAY THE MARKET WAS ABOUT TO MOVE BEFORE IT HAPPENED?  CLICK HERE To Join Our VIP ELITE GROUP  -- FREE!


Powered by 123ContactForm | Report abuse

Tuesday, 7 January 2014

Transports Update

Transports Update

Today is WEDNESDAY and today the ADP's payroll report, will be the warm-up act for Friday's jobs data, and will drive market direction more than usual Wednesday.

One reason is that the payroll-services provider's 8:15 a.m. data come ahead of the auction of $21 billion in reopened 10-year notes, 1 p.m. ET, and stronger-than-expected data could help yields rise, giving a concession to the market. Though not viewed as a true picture of the jobs report, the data have become more trusted among market players recently.

This should give us a bit of clarity for the jobs reports. Because right now if you look at the transports it is stuck within a skinny channel, and not really moving much. So this could be some sort of catalyst and driver.

Earnings are also expected Wednesday from Constellation Brands, Family Dollar, Ruby Tuesday and Monsanto but the big traders will be waiting for the payroll news. Right now the transports has been ranging inside a downwards channel, but it has not moved much at all.

Transports Update


WHAT IF YOU KNEW WHICH WAY THE MARKET WAS ABOUT TO MOVE BEFORE IT HAPPENED?  CLICK HERE To Join Our VIP ELITE GROUP  -- FREE!


Powered by 123ContactForm | Report abuse

Monday, 6 January 2014

vix update

vix update

The precursor to the main event this week is the FOMC (Federal Open Market Committee) minutes on Wednesday, then all eyes on the payrolls number, it seems the market is still scared of the word taper, but the more it gets used, the more traders are getting use to the fact it is coming to the market anyway. So that is sort of how you body builds up immunity to bugs when they attack your body.

It has not been the best start to 2014 however, that does not mean much as most the bigger traders are getting back to their desks this week so better volume should be coming.

The VIX still is floating around the 13's but does have room to move to the 16 level if traders do not like the biggest sets of news coming this week.

vix update
vix update

WHAT IF YOU KNEW WHICH WAY THE MARKET WAS ABOUT TO MOVE BEFORE IT HAPPENED?  CLICK HERE To Join Our VIP ELITE GROUP  -- FREE!


Powered by 123ContactForm | Report abuse

Friday, 3 January 2014

spx update

spx update

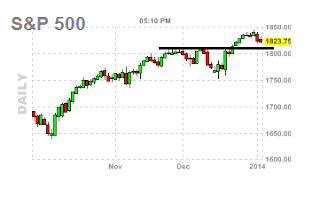
The main indexes closed with some mixed chop, sp -0.6pts. There probably risk of further downside early next week, and it seems the magnet for the S&P right now is the resistance level back in december 2013 of around the 1810 - 1811 area.


spx update
spx update


Lets be honest, it was pretty chopping trading this week, however, you must remember that the big wig traders, are actually still on holiday, and its still a quiet slow wet market right now.

Next week things really get back to normal, where we have the FOMC minutes midweek, and the monthly jobs data next friday, so things should be a bit more active I would think next week.

More updates coming!...

WHAT IF YOU KNEW WHICH WAY THE MARKET WAS ABOUT TO MOVE BEFORE IT HAPPENED?  CLICK HERE To Join Our VIP ELITE GROUP  -- FREE!


Powered by 123ContactForm | Report abuse

Thursday, 2 January 2014

dow jones transport update

dow jones transport update

The leader of the market did have quite a nice sell off today, back down to 7287. What I can say is that 2013 was a massive run, so the market was eventually going to see a day like today.

What is noticeable on this chart below is that every time we go down to 50 period moving average, we seem to bounce nicely off there. So right now as you are reading this, the 50 EMA is hanging around the 7116 mark, so we will see if the bears can get us back down there in the next week or so.

The money waves indicator right now is on a sell signal, and that means there could be lower prices coming, which again is another contributing factor or evidence that the bears could do a bit of damage here in the short term.


dow jones transport update

WHAT IF YOU KNEW WHICH WAY THE MARKET WAS ABOUT TO MOVE BEFORE IT HAPPENED?  CLICK HERE To Join Our VIP ELITE GROUP  -- FREE!


Powered by 123ContactForm | Report abuse
Wednesday, 1 January 2014

2014 Gold forecast

2014 Gold forecast

Back in 2013, gold was not only sold off, it was absolutely obliterated, I guess you could call it.

As you can see on the chart below, gold went from about $1700 an ounce, all the way down to $1200 an ounce. A $500 dollar move down in gold, is pretty big, however while everyone out there is very bearish on gold right now, and people are calling for a major crash, what I have seen is that there is major value in gold right now, and looking at the TRIX as the bottom of the chart it presents just a tremendous opportunity for more upside in gold soon. That is a REAL POSSIBILITY HERE, as I post this in early 2014.

This chart goes all the way back to the year 2000, and as investors we all must realize that things never go up in a straight line. Even know there is much bearishness around the place, its good to take a step back and see things for what they are worth longer term. Doing this exercise was not only interesting, but its starting to make me think you should watch this one very carefully.

There might be some real action in gold later this year, so its one for your radar EARLY TO MID 2014.


2014 Gold forecast


WHAT IF YOU KNEW WHICH WAY THE MARKET WAS ABOUT TO MOVE BEFORE IT HAPPENED?  CLICK HERE To Join Our VIP ELITE GROUP  -- FREE!


Powered by 123ContactForm | Report abuse