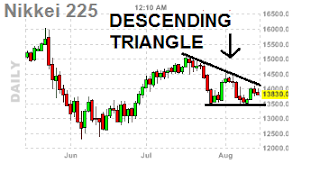
Today in the VIP room HERE we were discussing the NIKKEI daily chart.
The nikkei has not really being doing much after a large drop, however right now it seems to be in a bearish descending triangle pattern.
As you can see the buyers are slowly day by day getting squeezed by the sellers. The next few days shall be important for the nikkei, and the bulls need to do something, otherwise they could be overpowered by the bears.
 |
| descending triangle - nikkei chart |
Powered by 123ContactForm | Report abuse

No comments:
Post a Comment