Web Statistics The Sentiment Trader
Showing posts with label ascending triangle. Show all posts

Wednesday, 24 April 2013

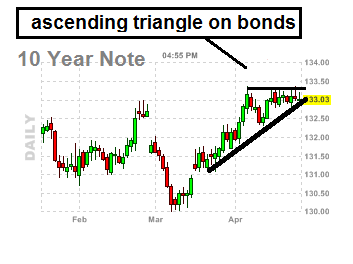
ascending triangle on bonds - hmmmmmmm

Taking a look at the 10 year bonds, we can see that the highs just under the 133 line have held really well. So much so, that we would not call this the resistant line on an ascending triangle.

See how both the sellers and buyers are now being squeezed and we  have a very very tight range. Normally ascending triangles are bullish patterns, and we shall see what happens in the next few days.

A breakout in the upwards direction on bonds, to the 133 - 134 area will again put pressure on the market.


ascending triangle pattern on bonds


WHAT IF YOU KNEW WHICH WAY THE MARKET WAS ABOUT TO MOVE BEFORE IT HAPPENED?  CLICK HERE To Join Our VIP ELITE GROUP  -- FREE 10 Day Trial Offer Today!


Powered by 123ContactForm | Report abuse


For all other enquiries ==>  CLICK HERE TO CONTACT US


Thursday, 18 April 2013

The bonds chart

The bonds chart

Taking a quick look at bonds, we can see that over the last few weeks, the bonds have produced an ASCENDING TRIANGLE.

These are seen as bullish patterns and more often then not precede higher prices, especially if we break that top resistance point at 133.40 mark.

If we do break this top resistance, that will probably not bode well for the market.  Time will tell.

bonds chart
bonds chart


WHAT IF YOU KNEW WHICH WAY THE MARKET WAS ABOUT TO MOVE BEFORE IT HAPPENED?  CLICK HERE To Join Our VIP ELITE GROUP  -- FREE 10 Day Trial Offer Today!


Powered by 123ContactForm | Report abuse


For all other enquiries ==>  CLICK HERE TO CONTACT US


Tuesday, 22 January 2013

Nasdaq chart - Nasdaq chart is telling

We can see that the Nasdaq or the leader of the market has been holding well. Right now on the daily chart you can clearly see we have an ADSCENDING TRIANGLE on a POLE and we have just broken out of the resistance and we are peeking our head just a little above that resistance line. Interesting!

In our view this is BULLISH looking chart and can preceed higher prices. Time will tell.

Happy trading.


Ascending Triangle
Ascending Triangle on a pole


WHAT IF YOU KNEW WHICH WAY THE MARKET WAS ABOUT TO MOVE BEFORE IT HAPPENED?  CLICK HERE To Join Our VIP ELITE GROUP  -- FREE 10 Day Trial Offer Today! 

Tuesday, 2 October 2012

Walking On Water

The S&P is still in limbo while we wait for some sort of direction. But I do have some interesting statistics for you today.

But first the S&P 500 chart.....

It seems that over the last week or so we have created an ascending triangle. These are seen as bullish patterns, but we must first break to the upside and resistance line of the pattern first for more buyers to come back in. I significant break below the bottom ascending line will bring upon more selling. So now we just sit and wait!!!!


My intuition is telling me the US administration is going to do whatever it takes to push the market up going into the elections. And when you control the Treasury and own the Fed you can control the Stock Market Direction, despite a horrendous unemployment situation and a near comatose economy.

As a side note, what I want to say here, is that OCTOBER each year is known for its extremely large sell offs and even crashes that can occur on the market. But let me be the first to tell you it has also been known as the "BEAR KILLER" meaning there has been very significant gains or rallies in OCTOBER too.

Hope that puts things in perspective for you.

Happy Trading :-)