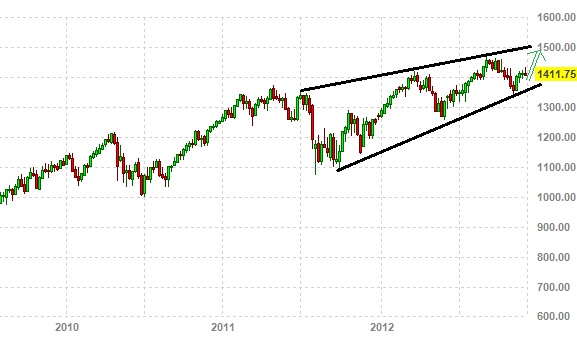
If we look at the spx weekly chart it is obvious that we are still in a large bearish wedge. However, the spx weekly chart is giving strong indication that since the end of 2011 we have been in a nice solid uptrend, and we do not expect anything to change right now.
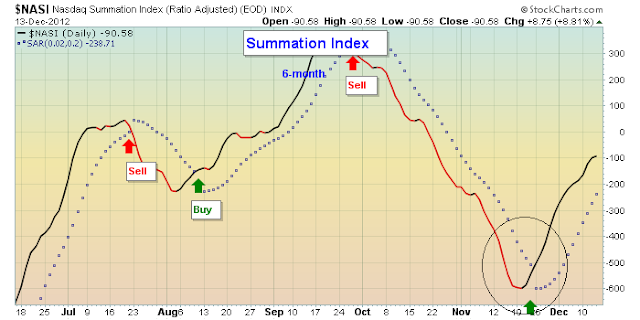
Even if we do get some kind of dip on the market here, (which is likely) the spx weekly chart along with summation (see below) is hinting that 1500 is coming on the market. YES! 1500! even though there are many bears out there and people calling for a crash, we feel that the spx weekly chart is saying to expect 1500 very soon!
The spx weekly chart is also saying, do not expect 1500 in 2012, we might have to wait till next year. 2013 for that to eventuate. Many traders are watching the fiscal cliff news, and trading that news. We are saying remain calm and watch the daily charts and spx weekly chart for clues. Hopefully the charts like this one, spx weekly chart are screaming loudly at what COULD happen in the next several weeks.
 |
| spx weekly chart |
The spx weekly chart is definatly looking strong, but we also have the sentiment trader top leading market breadth chart - SUMMATION. As you can see below, summation is still on a BUY or BUY DIPS stance, and has been since the middle of NOVEMBER.
 |
| spx weekly chart - Summation |
The spx weekly chart is telling us alot, but more importantly, no matter what happens in the next few weeks, or what happens regarding the fiscal cliff deal, the spx weekly chart is telling us not to fall in love with the downside.
Happy trading :-)
WHAT IF YOU KNEW WHICH WAY THE MARKET WAS ABOUT TO MOVE BEFORE IT HAPPENED? CLICK HERE To Join Our VIP ELITE GROUP -- FREE 10 Day Trial Offer Today!

No comments:
Post a Comment