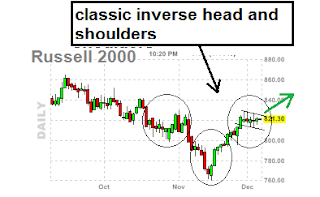
inverse head and shoulders
Just days ago the russell daily bar chart stuck out at me.
Today I am now starting to realize why? as an analyst I look for patterns that present themselves to be high probability patterns and that can warn us of moments on the market before they occur.
Have a look what I found here on the RUSSELL 2000 daily chart. An inverse head and shoulders pattern.
well, I would be calling this an inverted head and shoulders anyway. (drawn below)
This is a bullish pattern. Not only do we have an inverted head and shoulders, but a bullish flag pattern within the right shoulder (on that inverted head and shoulders) that seems to be forming. WOW!
The other thing I have to mention is that the RUSSELL 2000 has sort of been a leader the last few weeks on the market, so that is a tell tale sign in my book! Sentiment trader is liking the RUSELL 2000 and the S&P 500 here at the moment, and I would not be surprised to see it some positive (up) moment on these in the next several days.
Again nothing is set in stone, and nothing is foolproof and I am just calling it how I see it.
FED DAY coming and this also could have a positive effect on the market more so next week though.
FED DAY coming and this also could have a positive effect on the market more so next week though.
Please Note : I will be travelling interstate the next few days and will not be able to post on this blog for several days, do not panic I will be back. But in the mean time, good luck, and good trading to you all!. :-)
 |
| inverse head and shoulders |
WHAT IF YOU KNEW WHICH WAY THE MARKET WAS ABOUT TO MOVE BEFORE IT HAPPENED? CLICK HERE To Join Our VIP ELITE GROUP -- FREE 10 Day Trial Offer Today!

No comments:
Post a Comment